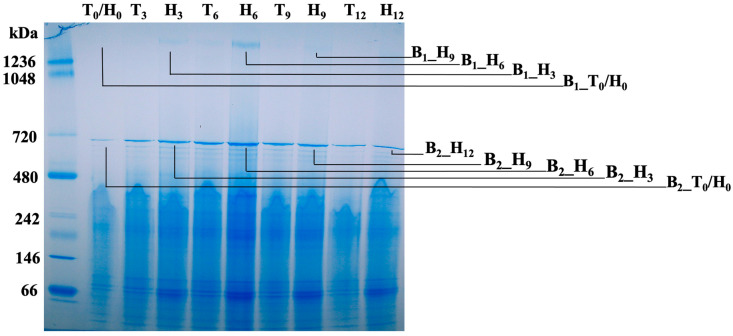
Figure 6.
BN-PAGE analyses of membrane protein change kinetics of the lysogenic bacterium grown in human serum. T: TSBYE broth; H: TSBYE broth with 50% human serum; Numbers (0, 3, 6, 9, and 12) represent hours of incubation. Protein bands at two positions, B1 at approximately the 1.5 mDa position and B2 at the position of ~700 kDa, were detected from the lysogen with particularly strong signals after 6 h exposure in human serum. Four excised gel samples at the B1 position prepared as B1_T0/Ho, B1_H3, B1_H6, and B1_H9, and five samples at the B2 position prepared as B2_T0/Ho, B2_H3, B2_H6, B2_H9, and B2_H12, were collected for semi-quantitative LC/MS analysis and data are described in Table 3 and Table 4.

