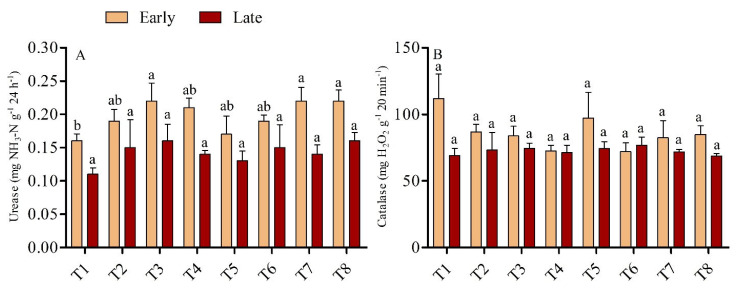
Figure 2.
(A,B): Soil urease (A) and catalase (B) activity during the early and late seasons under low- and high-dose urea application and different levels of biochar application. Note: T1: N1B0 = 135 kg N ha−1 + 0 t B ha−1; T2: N1B1 = 135 kg N ha−1 + 10 t B ha−1; T3: N1B2 = 135 kg N ha−1 + 20 t B ha−1; T4: N1B3 = 135 kg N ha−1 + 30 t B ha−1; T5: N2B0 = 180 kg N ha−1 + 0 t B ha−1; T6: N2B1 = 180 kg N ha−1 + 10 t B ha−1; T7: N2B2 = 180 kg N ha−1 + 20 t B ha−1; and T8: N2B3 = 180 kg N ha−1 + 30 t B ha−1. Bars with different letters are significantly different, at p < 0.05.

