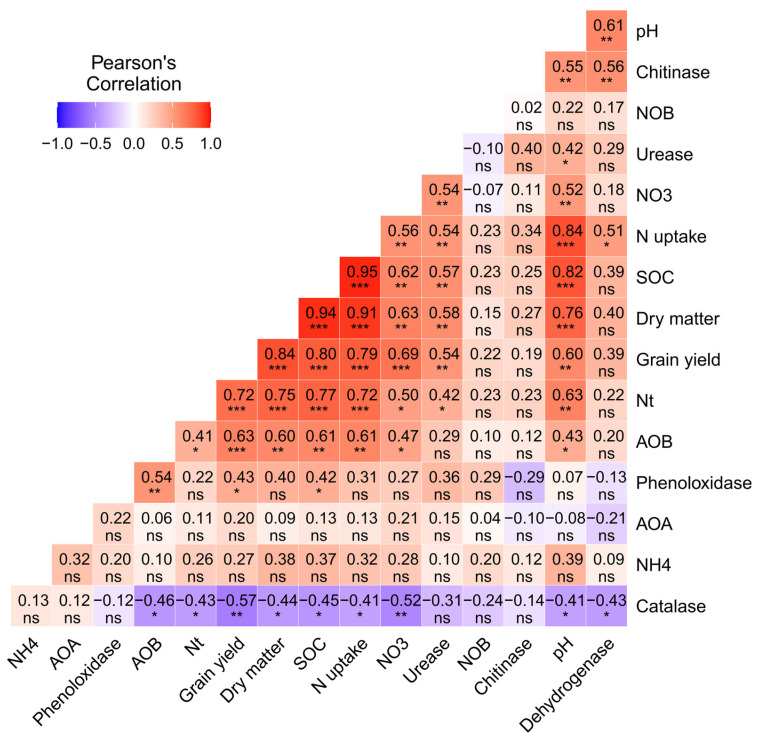
Figure 7.
Correlation heat map of soil properties; enzyme activities; abundances of AOB, AOA, and NOB; N uptake; DM; and grain yield of rice. Red colors indicate positive relationships, and dark blue colors indicate negative relationships. The colors carried from white to red and white to blue indicate moderately to strong positive/negative correlations, respectively. Note: SOC; soil organic carbon, Nt; total nitrogen, NH4; ammonium nitrogen concentration, NO3; nitrite nitrogen concentration, AOB; ammonium-oxidizing bacteria, AOA; ammonium-oxidizing archaea, NOB; nitrite-oxidizing bacteria. * indicate the significant difference at (p < 0.05), ** indicate the significant difference at (p < 0.01), and *** indicate the significant difference at (p < 0.001), whereas ns indicate non-significant (p ≥ 0.05).

