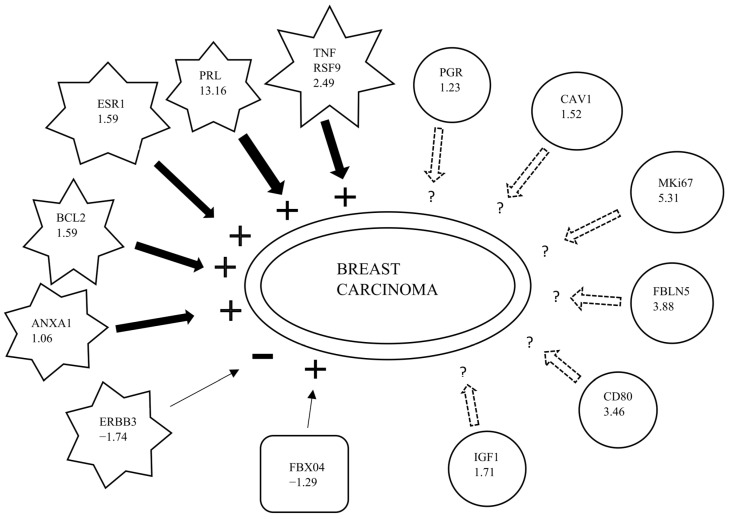
Figure 1.
Fold change ratios (no’: s within symbols) for CEE/MPA vs. (E2)/P for thirteen genes affecting breast carcinoma. Star-shaped symbols represent genes increasing breast carcinoma when activated. Plus: +—sign represents net effect of increasing breast carcinoma inclination. Minus: −sign represents net effect decreasing breast carcinoma inclination. Rectangle represents gene with protective effect against breast carcinoma. Thick black arrows represent positive FC ratios. Thin black arrows represent negative FC ratios. Dotted arrows indicate findings inconsistent with state of downstream molecule. The biological function “breast carcinoma” was augmented more for CEE/MPA than for (E2)/P at a very high significance level (p = 3.1 × 10⁻⁸, z-score = 1.94). (Adapted information from IPA database, Ingenuity Systems).

