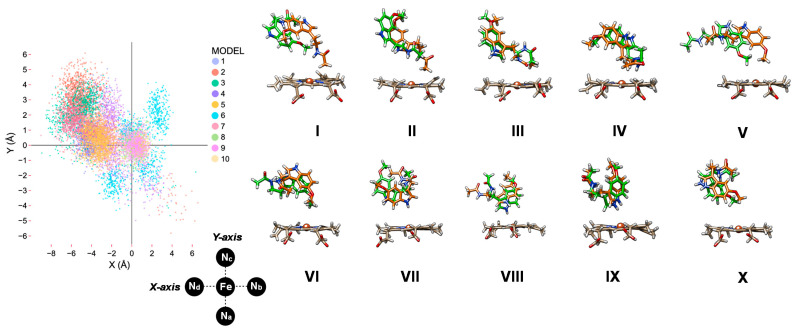
Figure 4.
Left: Scatter plot of the position of the substrate position with respect to the heme. The iron is in the origin and the X- and Y-axis are along the Nd-Fe-Nb and Na-Fe-Nc bonds. Right: Melatonin position in the start (after 1 ns in orange) and end (after 100 ns in green) configurations of the MD simulation for MD simulation I to X.

