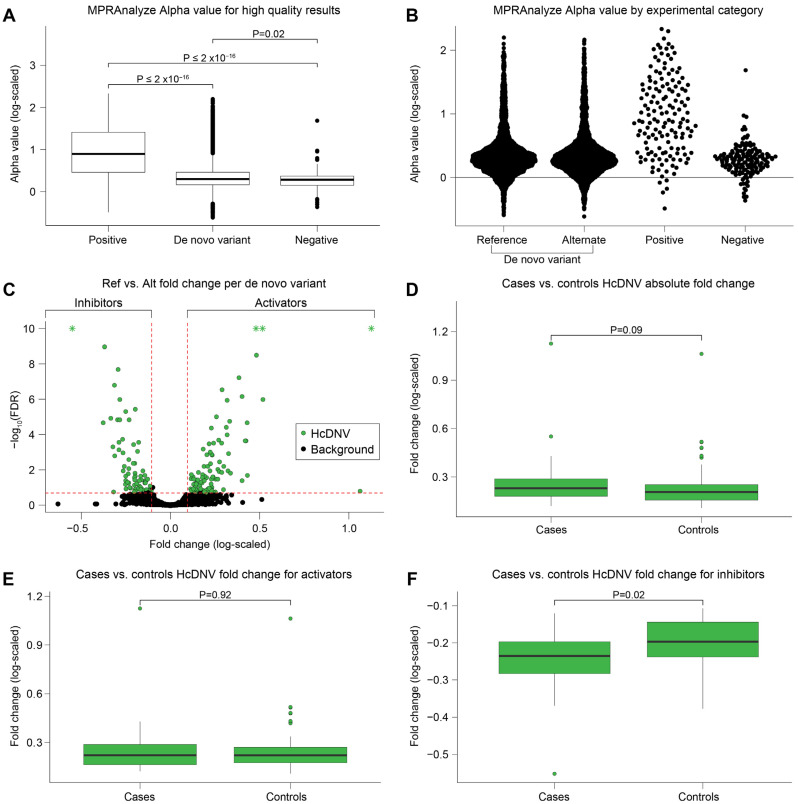
Figure 2.
MPRAnalyze results. (A) Boxplot comparing the log of the alpha value reported by MPRAnalyze. The p-values above the boxes are Wilcoxon rank sum test p-values comparing the alpha value between the boxes indicated by the end of the brackets. (B) Swarm plot of the log alpha values reported in (A) showing the density and distribution of the values. (C) Volcano plot showing the natural log fold change between the alternate allele alpha value over the reference allele alpha value on the x-axis and the –log10 of the MPRAnalyze FDR reported for the differential expression on the y-axis. Y-axis values greater than 10 have been lowered to 10 and marked with an “*” to zoom in the graph. (D–F) Boxplots comparing the log fold change values between HcDNV cases and controls for the absolute value of the log fold change (D), activators only (E), and inhibitors only (F).

