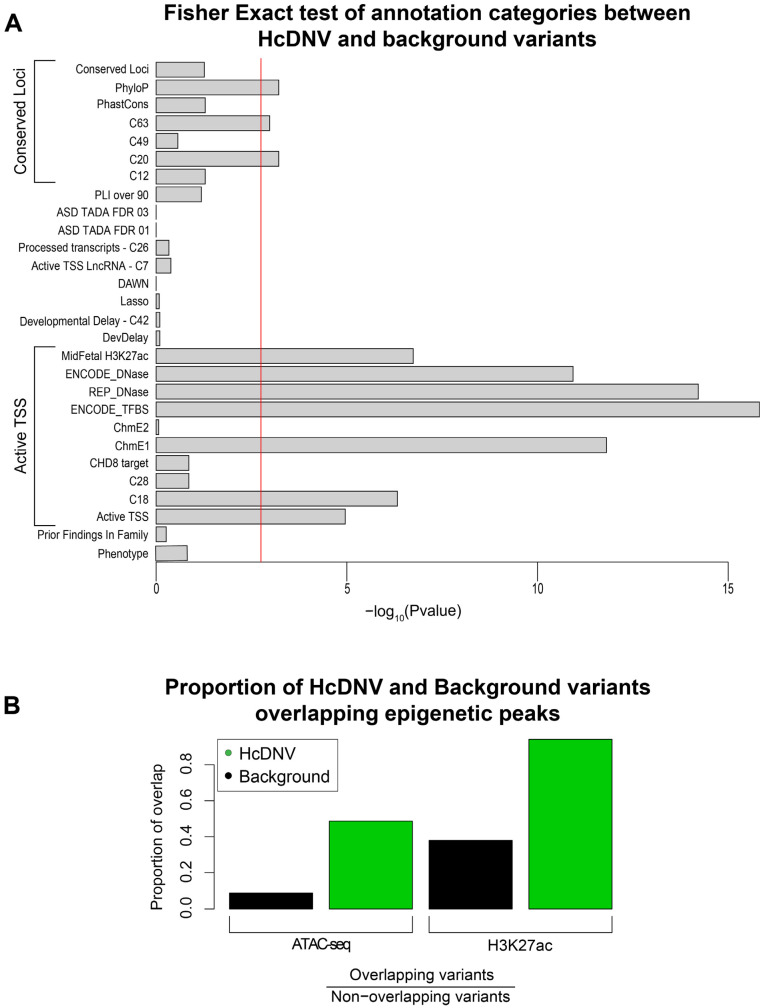
Figure 3.
Characterization of variant involvement in regulatory and epigenetic regions. (A) Barplot of Fisher’s exact p-values comparing the proportion of HcDNV and background variants found in each annotation category. The red line indicates the Bonferroni multiple testing-corrected p-value threshold. (B) Barplot of the proportion of overlap of HcDNV and background variants with H3K27ac and ATACseq peaks. ATACseq p-value = 5.4 × 10⁻¹⁸; H3K27ac p-value = 4.0 × 10⁻⁸.

