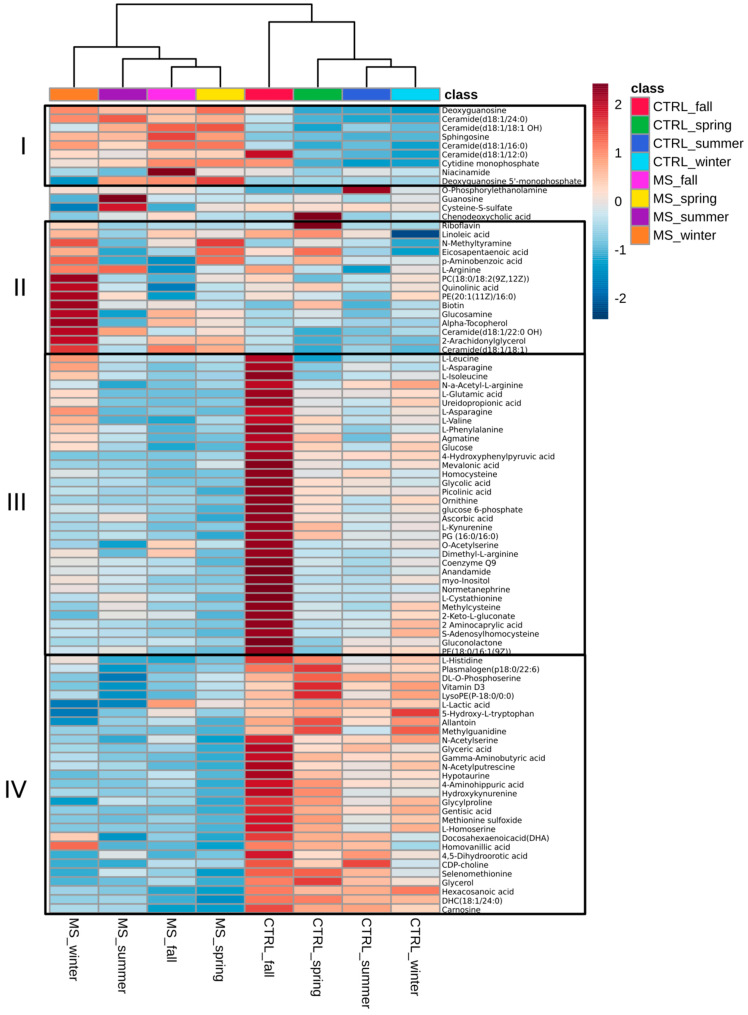
Figure 2.
Heatmap analysis of metabolites in MS and control. Hierarchical cluster analysis was performed using Euclidean distance measure and Ward’s linkage clustering algorithm. Average values for each metabolite were used for analysis. Heatmap analysis is produced using MetaboAnalyst 5.0 (Available online: https://www.metaboanalyst.ca (accessed on 25 December 2022)). All presented metabolites differed significantly between at least one comparison group (p adj. < 0.05, one-way ANOVA with Fisher’s LSD).

