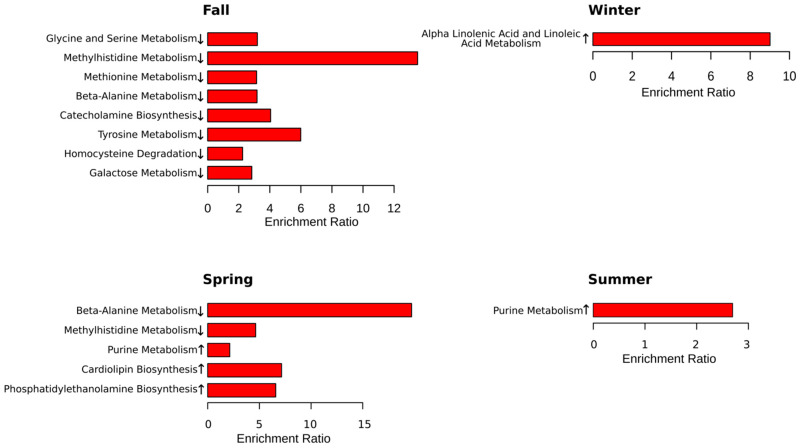
Figure 4.
Metabolic pathways significantly enriched in each season. Enrichment analysis was performed in MetaboAnalyst 5.0 (Available online: https://www.metaboanalyst.ca (accessed on 8 November 2022)) using The Small Molecule Pathway Database (SMPDB, Available online: https://smpdb.ca (accessed on January 2014)). Enrichment ratio is computed by hits/expected, where hits = observed hits; expected = expected hits. ↑—increased serum level of metabolites included in the metabolic pathway in MS compared to control; ↓—decreased serum level of metabolites included in the metabolic pathway in MS compared to control.

