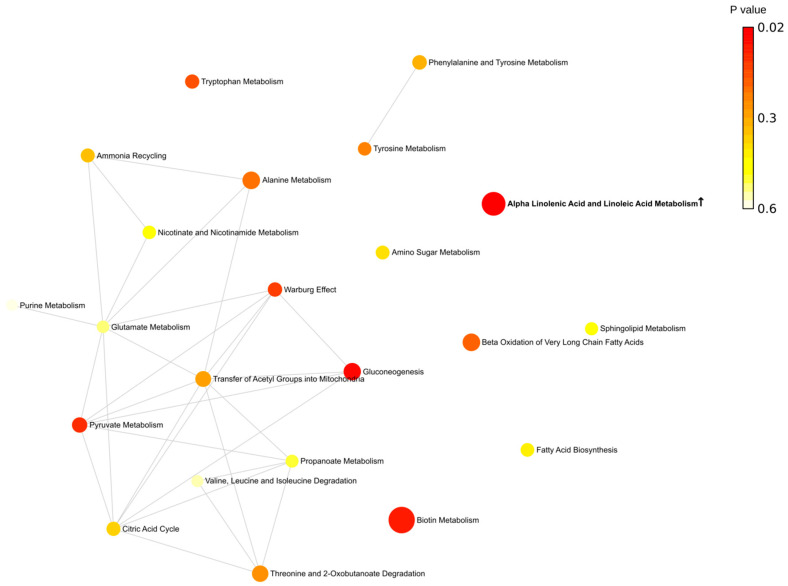
Figure 8.
Metabolic pathways enriched in winter. Bold indicates significantly enriched pathways (p < 0.05). ↑—increased serum level of metabolites included in the metabolic pathway in MS compared to control. Each node represents a metabolite set with its color based on its p value and its size based on fold enrichment. Two metabolite sets are connected by an edge if the number of their shared metabolites is over 25% of the total number of their combined metabolite sets. The yellow to red color gradient and larger size of the circle indicate lower p value.

