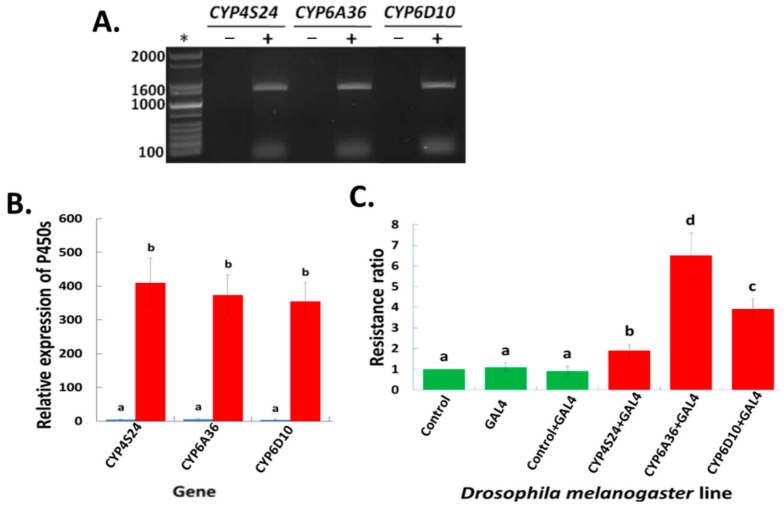
Figure 3.
Transgenic study of CYP4S24, CYP6A36 and CYP6D10 in D. melanogaster. (A) RT-PCR amplification of the P450 genes in transgenic D. melanogaster lines. “−” represents the non-transgenic empty-vector control D. melanogaster line. “+” represents the transgenic D. melanogaster lines containing house fly P450 genes. * The GelPilot 1Kb (+) ladder was used as a molecular size reference, with the numbers on the figure indicating the DNA band size in bp. (B) Transgenic expression of CYP4S24, CYP6A36 and CYP6D10 in D. melanogaster. The relative expressions of the three transgenes were quantified via qRT-PCR. “P450” represents the homozygous transgenic D. line with house fly P450 genes, and “P450 × GAL4” represents the F1 generation of the homozygous transgenic Drosophila line crossed with GAL4 driver line. Data shown as mean + S.E.M (n = 3). (C) Toxicity of permethrin to non-transgenic and transgenic D. melanogaster lines. Resistance ratios = LD50 of D. melanogaster lines/LD50 of control line. There were no significant differences in expression levels labeled with the same letter (p < 0.05).

