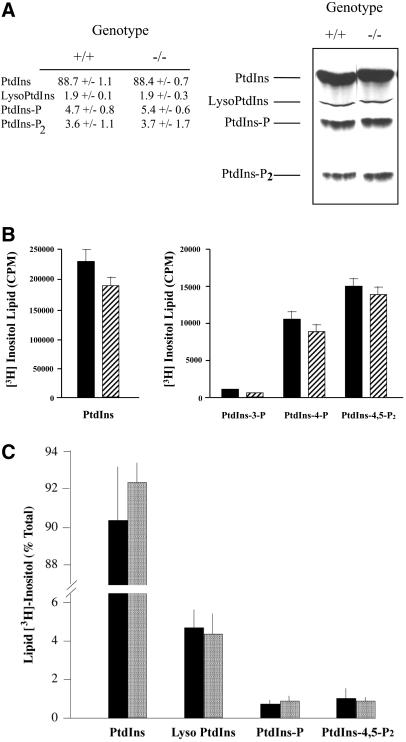
Figure 4.
Steady-state levels of inositol phospholipids. (A) ES cells were labeled to steady state with [3H]inositol, and phospholipids were extracted and resolved by TLC (see MATERIALS AND METHODS). A representative chromatogram is given (right) with identification of lipid species (left) and PITPα genotype (top). At left are given the quantitative data obtained from the average of three independent experiments. (B) ES cells were labeled to steady state with [3H]inositol, phosphoinositides were extracted, deacylated in the presence of methylamine, and the corresponding glycerophospho-derivatives were resolved by anion exchange chromatography (Stolz et al., 1998). The left panel presents the deacylated PtdIns data for PITPα +/+ (solid bars) and −/− cells (hatched bars), whereas the right panel shows data for deacylated PtdIns-3-P, PtdIns-4-P, and PtdIns-4,5-P2. All values represent averages of at least three independent experiments. (C) ES cells were pulse radiolabeled for 1 h with 100 μCi/ml of [3H]inositol. Lipids were extracted and resolved by TLC, identified by autoradiography, scraped, and quantified by scintillation counting. Data are expressed as percentage of total lipid [3H]inositol incorporated into each lipid species identified at bottom. Values from PITPα +/+ (solid bars) and −/− cells (stippled bars) are given. PtdIns-P represents the sum of PtdIns-4-P and PtdIns-3-P values. Data represent the averages of three independent experiments.

