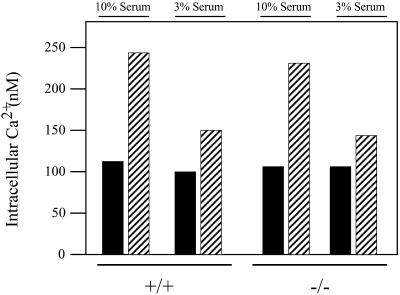
Figure 5.
Bulk signaling properties of PITPα +/+ and −/− cells. ES cells were serum starved for 2 h, loaded with fura 2, and stimulated with serum (3 or 10%). Ratios of fura 2 excitation at 340 and 380 nm were determined and converted to absolute calcium concentrations. These concentrations are presented as a function of serum concentration used to stimulate cells (top) and PITPα genotype (bottom). Values represent the averages and SDs of cytosolic Ca2+ concentrations measured for 69 PITPα +/+ and 67 PITPα −/− cells in the 10% serum stimulation condition, and 48 PITPα +/+ and 45 PITPα −/− cells in the 3% serum stimulation condition, respectively.

