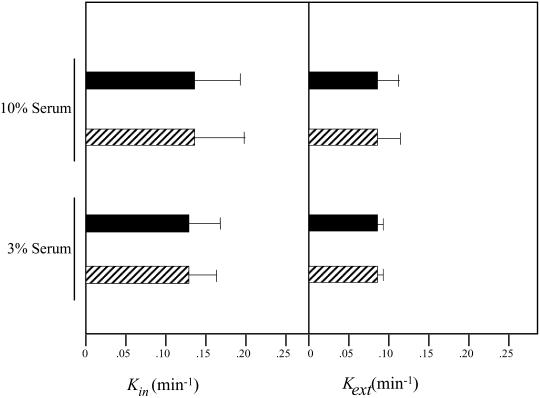
Figure 7.
(A) Steady-state distribution of TfR on the cell surface of PITPα +/+ and −/− cells. Steady-state distribution of TfR was performed as described previously at 37°C (Odorizzi et al., 1994; see MATERIALS AND METHODS) with the modification that PITPα +/+ and −/− ES cells were plated in triplicate in standard media containing either 10 or 3% serum. The percentage of total 125I-Tf (and therefore TfR) located at the cell surface (solid bars) and within the cell (hatched bars) is given for each ES cell PITPα genotype (+/+ or −/−; bottom) and for each serum concentration tested (3 and 10%; top). (B) Kinetics of TfR internalization and recycling in PITPα +/+ and −/− cells. For internalization assays, PITPα +/+ (solid bars) and −/− cells (hatched bars) were preincubated in serum-free media at 37°C and prewarmed 125I-Tf was added for various times up to 10 min. At each time point, the ratio of internalized and surface 125I-Tf was distinguished by an acid strip of the cell surface, and Tf(internal)/Tf(surface) ratio was plotted as a function of time. The slope of each curve yields the TfR internalization constant kin, and the data represent the mean and SDs derived from at least three independent determinations. To measure the recycling constant kext, cells were incubated with 125I-Tf for 1 h at 37°C and chilled. Surface-bound 125I-labeled Tf was removed by chelation with deferosamine at 4°C, cells were warmed to 37°C to initiate chase of 125I-Tf from endocytic compartments to the cell surface, and measurements of cell-associated and -released radioactivity were taken at various times of chase. The Tf(secreted)/Tf(internal) ratio was plotted against time, and the slope of each curve yields kext. The data represent the mean and SE derived from at least three independent determinations.

