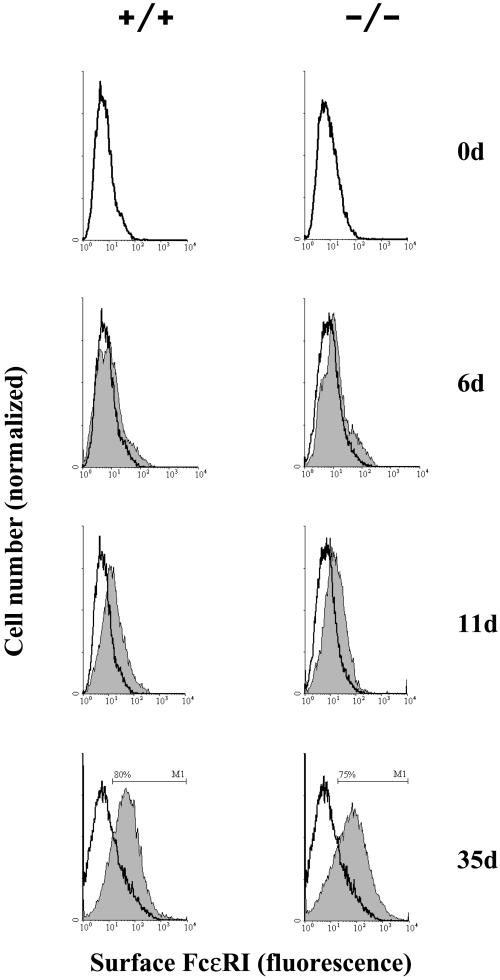
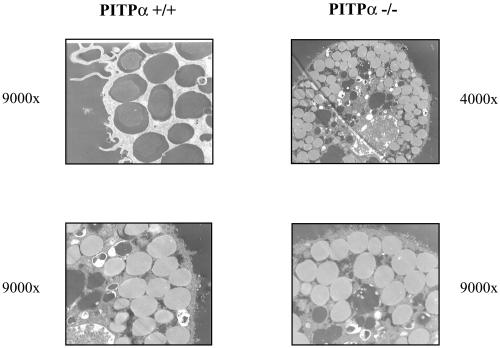
Figure 8.
(A) Expression of IgE binding sites on the surface of +/+ and isogenic PITPα −/− ES cells during phase 2 culture. Cells were treated with FITC-labeled IgE (5 nM) and surface IgE-FITC was quantified by flow cytometry. Shaded histograms represent populations from phase 2 cultures with ages in days indicated at right. Results from −/− cells are in the right-hand panels. Control cells (open histograms) represent passage-matched cells maintained for the same period exclusively in phase 1 medium. Results are representative of three independent experiments. (B) Mast cells from isogenic PITPα +/+ and −/− ES cells (genotype at top) were visualized by thin-section electron microscopy. Magnifications for each panel are given. PITPα +/+ and −/− ES cells yielded mast cells packed with morphologically correct dense core secretory granules.


