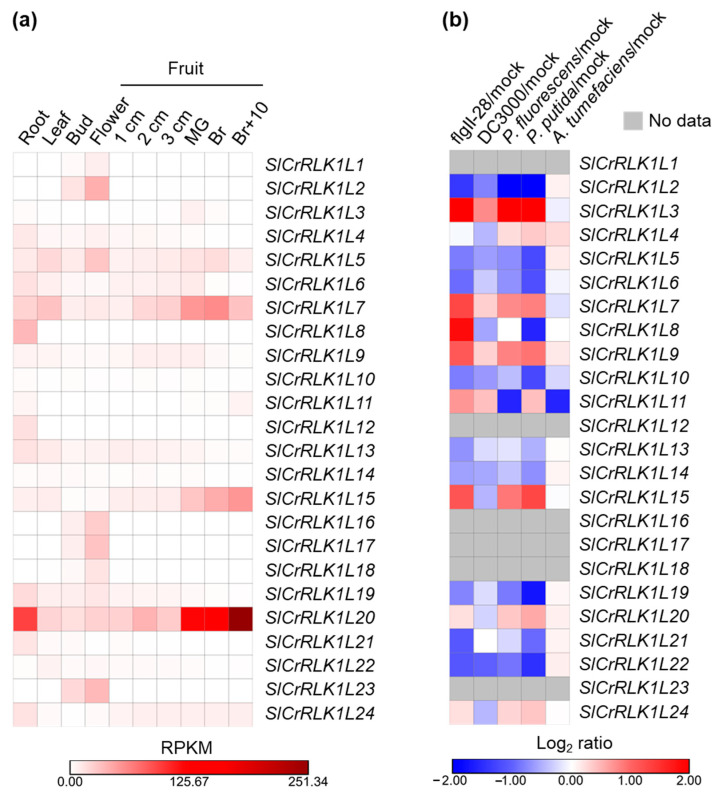
Figure 7.
Expression pattern analysis of SlCrRLK1Ls. (a) Heatmap of SlCrRLK1L expressions in a variety of tissues. RPKM: reads per kilobase per million mapped reads. (b) Heatmap of SlCrRLK1L expressions in various bacteria and PAMP. No available data are represented by a gray color. All of the data were acquired from the SGN RNA-seq database.

