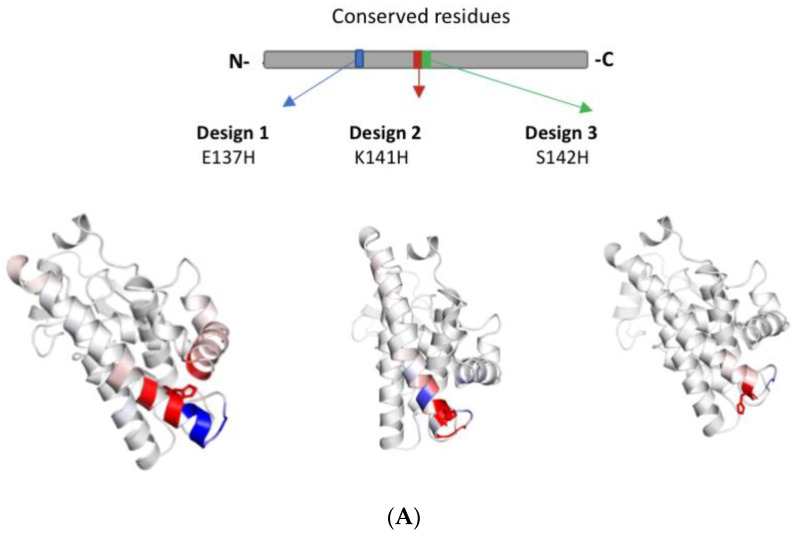
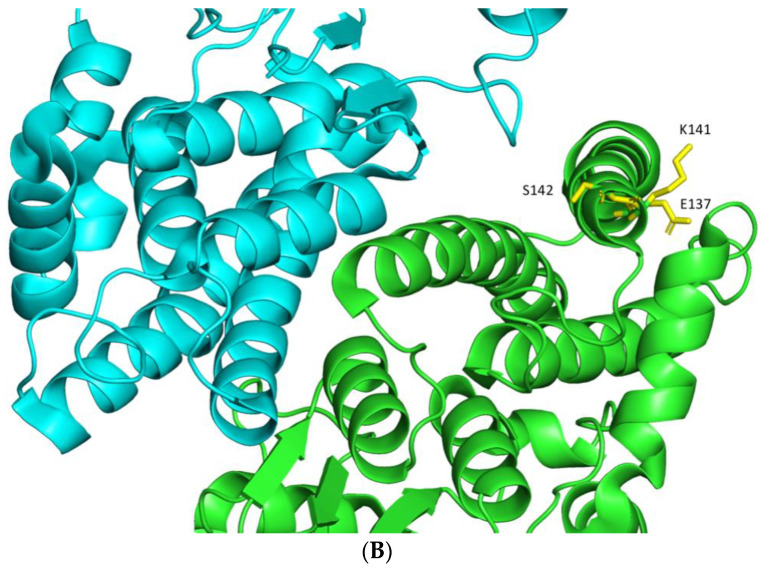
Figure 2.
Computational assessment of hGSTA1-1 flexibility by using DynaMut [27]. (A) Amino acids are colored according to the vibrational entropy change upon mutation. The blue color represents a rigidification of the structure, and the red one a gain in flexibility. (B) The positions of the selected residues are shown in the native structure hGSTA1-1 (PDB code: 1PKZ) as sticks of yellow color. The different chains of the dimer are depicted in cyan and green color. The figure was created using the PyMOL Molecular Graphics System [30].


