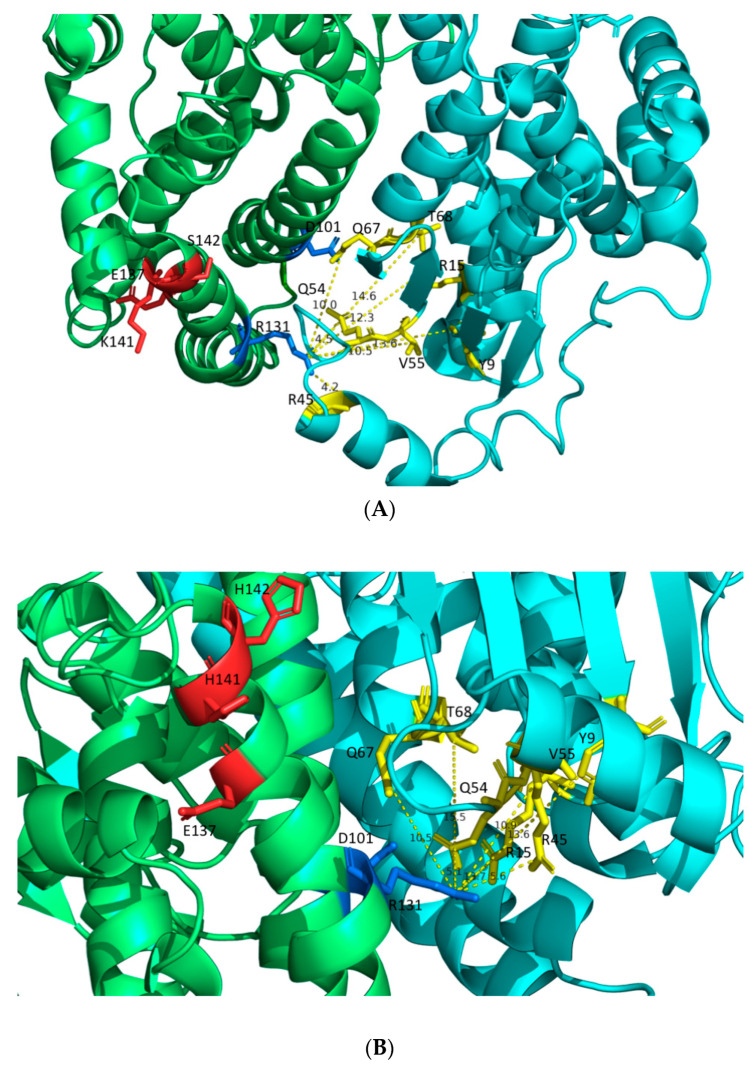
Figure 9.
(A) Distances between R131′ and G-site residues of hGSTA1 (PDB code: 1PKZ [28]). (B) Distances between R131′ and G-site residues of hGSTA1-K141H/S142H. The distances are shown in dashed yellow lines. The G-site residues of the enzymes (Y9, R15, R45, Q54, V55, Q67, and T68) are presented in yellow. The two molecules of the dimer are shown in lime green and cyan. The residues D101 and R131 of the second molecule in the dimer are presented in marine. The residues E137, K141, S142, H141, and H142 are presented in red. The analysis was carried out using the PyMOL Molecular Graphics System [30].

