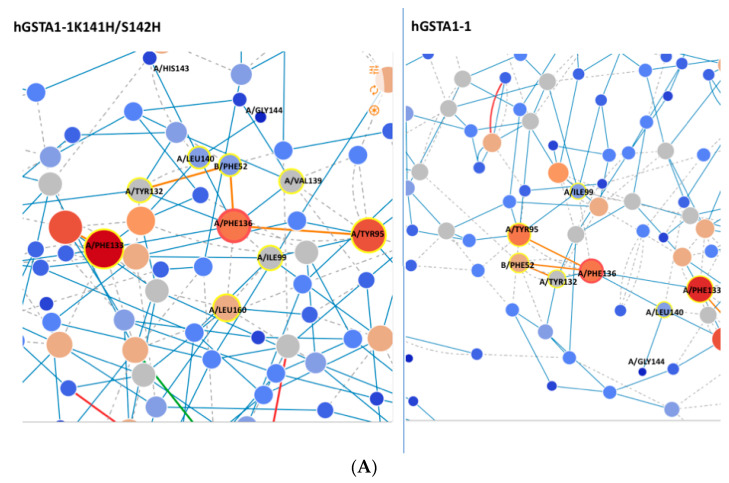
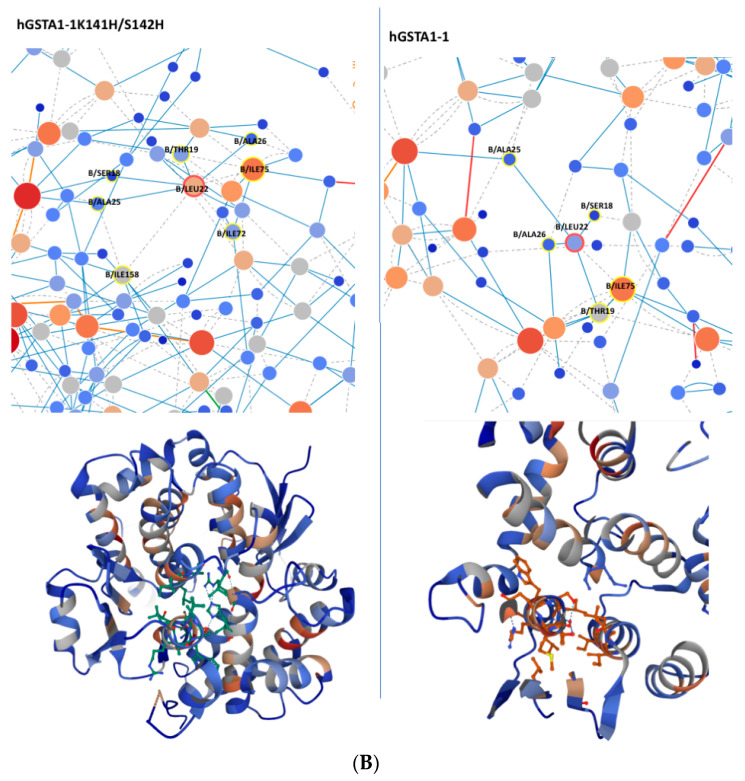
Figure 10.
(A) Network around Phe136 of hGSTA1-K141H/S142H and hGSTA1-1; (B) network around Leu22 of hGSTA1-1. The picture was created with the program RING [37]. Blue, grey, green, and red lines represent H-bond, van de Waals, π-cation, and π-π stack interactions, respectively.


