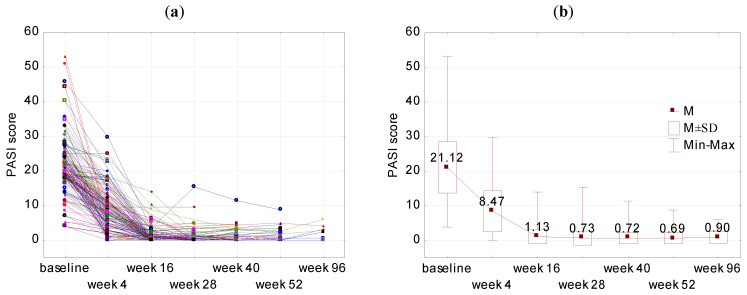
Figure 1.
Changes in the PASI at weeks 4 (N = 136), 16 (N = 145), 28 (N = 100), 40 (N = 93), 52 (N = 62), 96 (N = 22). (a) PASI score in all study participants and (b) the mean PASI score with standard deviation (SD) during study timepoints. p < 0.001 for PASI at weeks 4, 16, 28, 40, 52 and 96 in all the comparisons to the baseline. p for Student’s t test for paired data.

