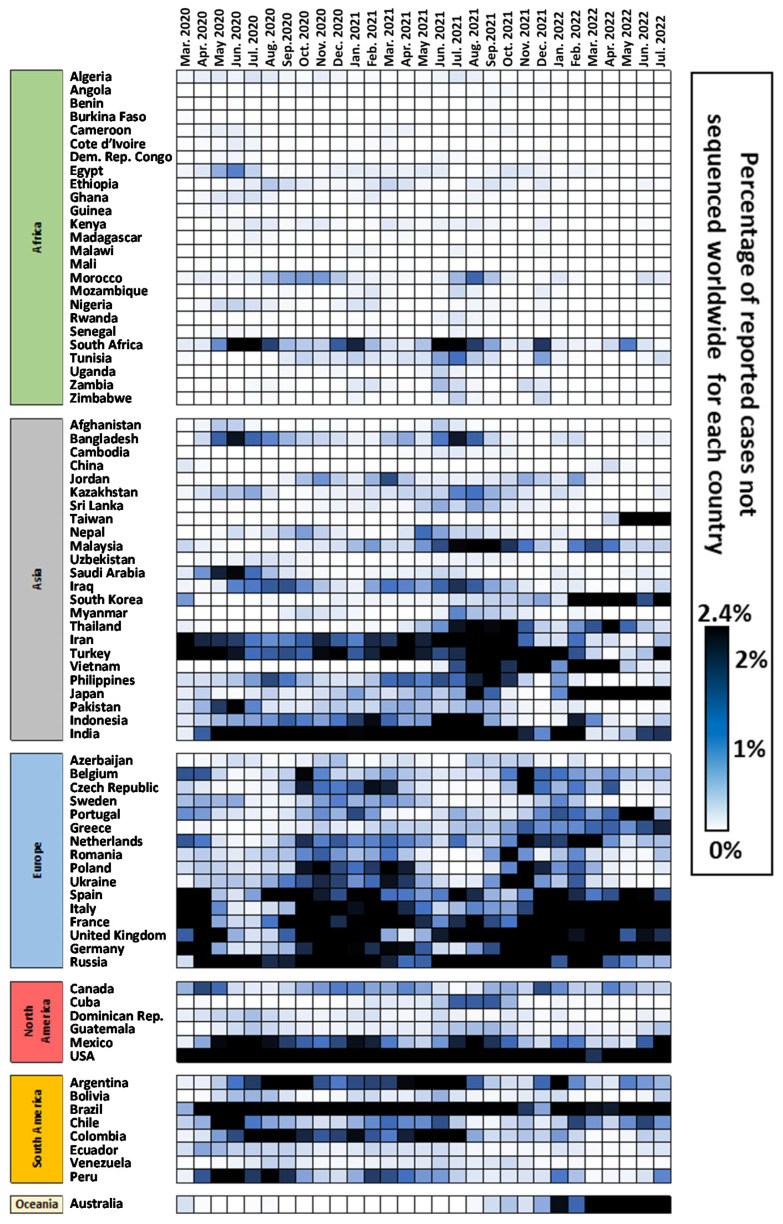
Figure 5.
Heat map representing the percentage of hypothetical uncharacterized genomes present in each country against the hypothetical global values. A scale from white to blue to black indicates an increasing percentage. Black indicates that in that month, that country accounts for 2.4% or over of genetically uncharacterized SARS-CoV-2 genomes in the world.

