Figure 1.
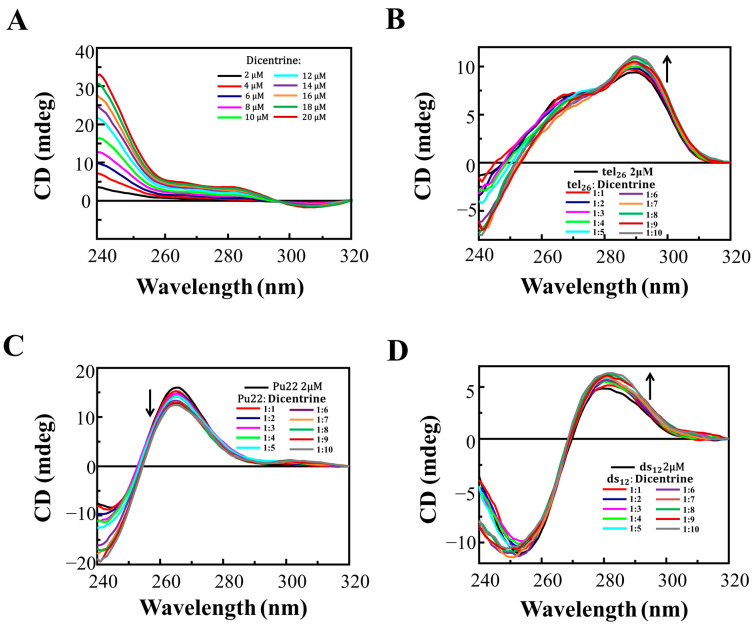
(A) CD spectra of solutions of Dicentrine (from 2 to 20 µM) in 5 mM KCl, 5 mM KH2PO4, 5% DMSO buffer (pH 7) and CD spectra of 2 μM solutions of (B) tel26 G-quadruplex, (C) Pu22 G-quadruplex and (D) ds12 duplex in 5 mM KCl, 5 mM KH2PO4, 5% DMSO buffer (pH 7) in the presence of increasing amounts of Dicentrine (up to 10 equivalents). Arrows indicate the CD changes on increasing the ligand concentration.

