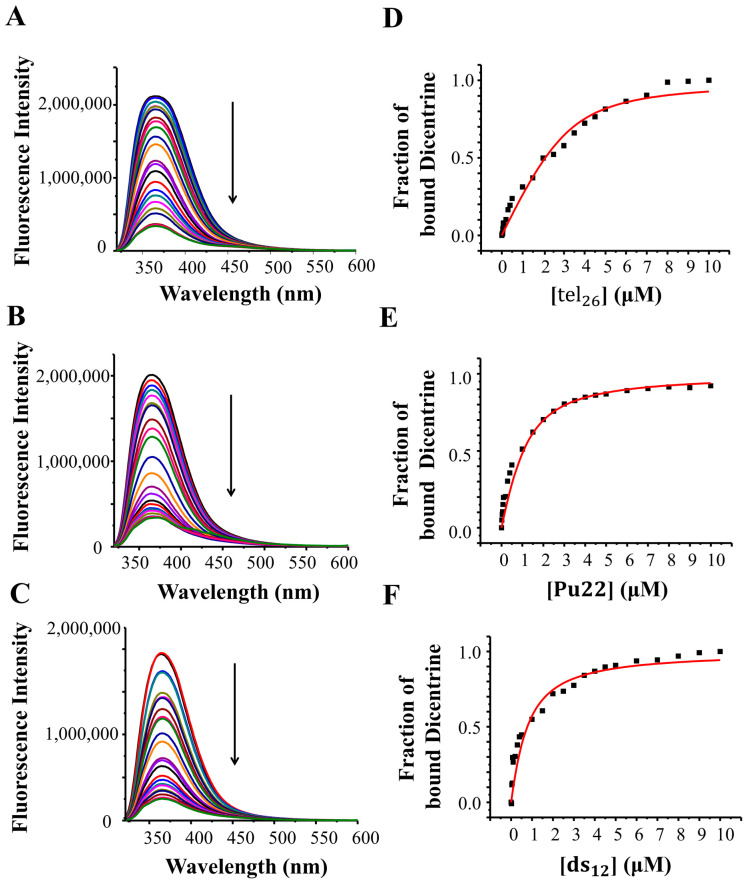
Figure 4.
Left: Fluorescence emission spectra obtained by adding increasing amounts of (A) tel26 G-quadruplex, (B) Pu22 G-quadruplex and (C) ds12 duplex to 2 μM solutions of Dicentrine. Arrows indicate the fluorescence intensity changes upon increasing the DNA concentration. Right: Representative binding curves obtained by plotting the fraction of bound Dicentrine to (D) tel26 G-quadruplex, (E) Pu22 G-quadruplex and (F) ds12 duplex as a function of the DNA concentration. The black squares represent the data from a single experimental replicate; the red line represents the best fit obtained using an independent and equivalent-sites model.

