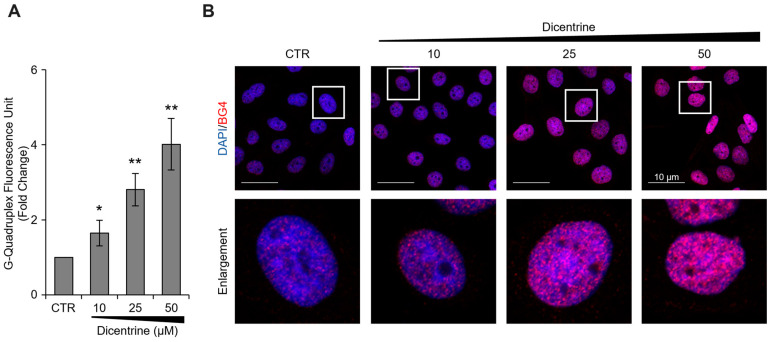
Figure 11.
Biological evaluation of the G-quadruplex-stabilizing activity of Dicentrine. Immunofluorescence analysis of G-quadruplex structures in Hela cells treated for 24 h with DMSO (negative control) or with increasing doses of Dicentrine (10, 25, 50 µM). (A) Quantitative analysis of the anti-G-quadruplex signal. For each panel, at least 25 cells/conditions were analyzed using the ImageJ software, and the results were expressed as the fold change in the fluorescence intensity over the negative control. Histograms show the mean ± SD of three independent experiments performed in triplicate. * p < 0.05; ** p < 0.01. (B) ) Upper Panels: representative images of confocal sections (63×) used for the detection of G-quadruplex structures. For each experimental condition, merged images of DAPI counterstained nuclei (blue) and G-quadruplex structures (red) are shown. Lower panels: enlargements (4×) of a single cell from each of the upper panels (white squares) are shown. Scale bars (10 µm) are reported in the figures.

