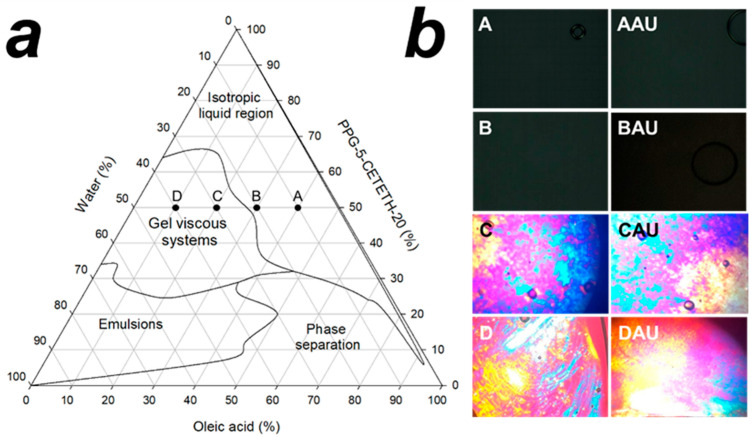
Figure 1.
Phase ternary diagram of PPG-5-CETETH-20, oleic acid, and water mixture and their macroscopic visual characterization regions: inner symbols denoted the chosen formulations (a); polarized light microscopy obtained at 40× of magnification (b). A = formulation with OA%/S%/W% ratio of 40/50/10; B = formulation with OA%/S%/W% ratio of 30/50/20; C = formulation with OA%/S%/W% ratio of 20/50/30; D = formulation with OA%/S%/W% ratio of 10/50/40; AAU = formulation A loaded with AU; BAU = formulation B loaded with AU; CAU = formulation C loaded with AU; DAU = formulation Dloaded with AU.

