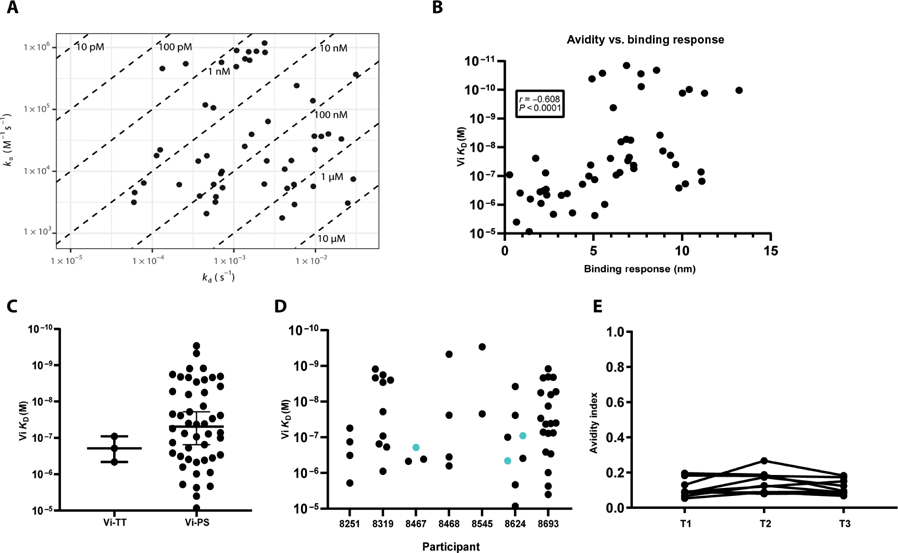
Fig. 3. No evidence for affinity maturation of Vi polysaccharide antibodies after repeat vaccination.
(A) Isoaffinity plot indicating avidity measurements for mAbs (n = 53) to polymeric Vi polysaccharide by BLI. Diagonal lines indicate the KD values shown. (B) Spearman correlation of Vi antibody avidity and binding response to Vi antigen. Negative correlation represents decrease in KD, which corresponds to an increase in avidity. (C) Avidity measurements (KD) of Vi binding mAbs stratified by Vi-TT prime/Vi-PS boost. (D) Avidity measurements (KD) of Vi binding mAbs stratified by participant, with blue indicating mAbs from prime time points. (E) Total serum (T1, n = 10; T2, n = 8; T3, n = 10) was used to measure residual Vi antibody binding after NaSCN exposure for 15 min in ELISA, as a proxy for avidity measurements. The avidity index was calculated as absorbance at 1 M NaSCN/(absorbance at 0 M NaSCN − absorbance at 5 M NaSCN). T1, 28 days after prime; T2, before Vi-PS boost; T3, 28 days after Vi-PS boost.

