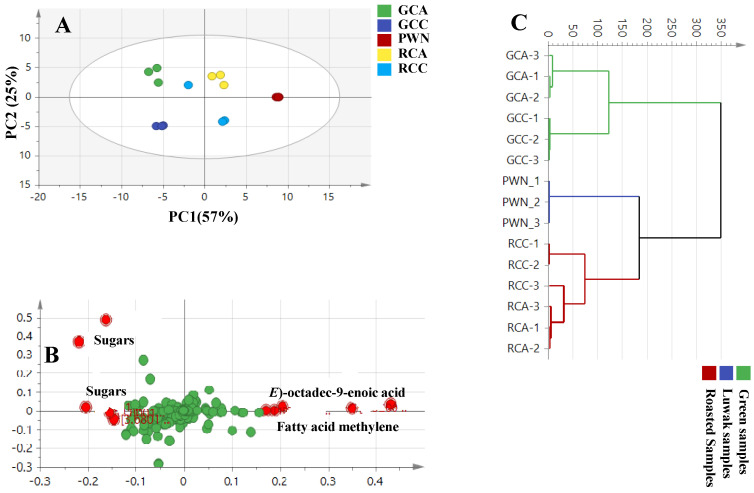
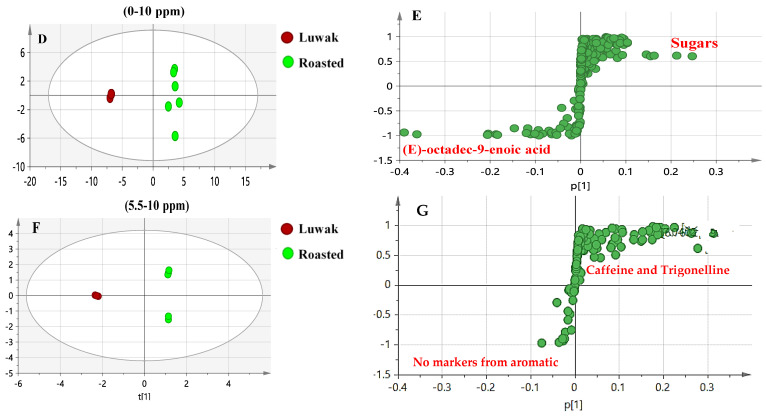
Figure 3.
(A) The principal component analysis (PCA) score plot. (B) The loading plot of all the coffee samples, analyzed using NMR. (C) Hierarchical cluster analysis (HCA) plot. (D) OPLS-DA model for the roasted samples (RCA and RCC) vs. the Luwak coffee (PWN). (E) The S-loading plot showing the covariance p [1] against the correlation p(cor) [1], analyzed by 1 H NMR, shown at a full scale (F) OPLS-DA score plot for the roasted samples versus the roasted aromatic region. (G) The S-loading plot for the aromatic region. Selected variables are highlighted and discussed in the text.


