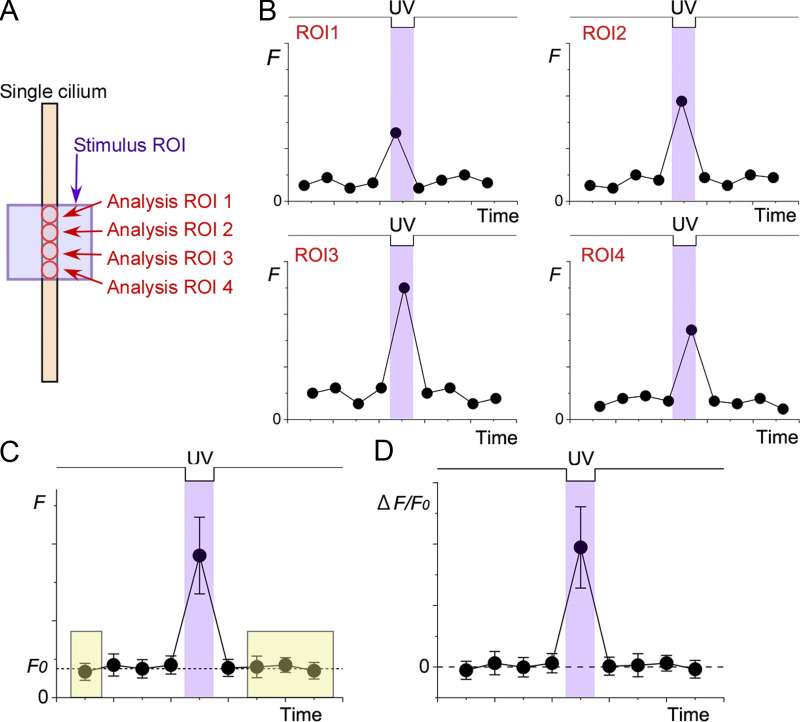
Figure 2.
Measurement and averaging of fluorescence intensity. (A) Selection of ROI for scan in a single cilium. The UV stimulation area (stimulus ROI) is shown with a purple square. For UV stimulation, scan mode or bleach mode was selected. Analysis ROIs (red circles) were selected along the single cilium after the image was obtained with an excitation laser (488 nm). (B) Fluorescence intensities in each analysis ROI were obtained as F and plotted against time. Note that the timings for measuring F differ depending on the location. Data points are randomly fluctuating values as a model, not the real data. (C) The average of the F. Error bars are the SD. The timing was set to the middle of the ROIs. F0 was obtained as an average from the data points of the basal level (e.g., yellow shadows). (D) ΔF/F0 calculated from C. ΔF is F − F0.

