Figure 7.
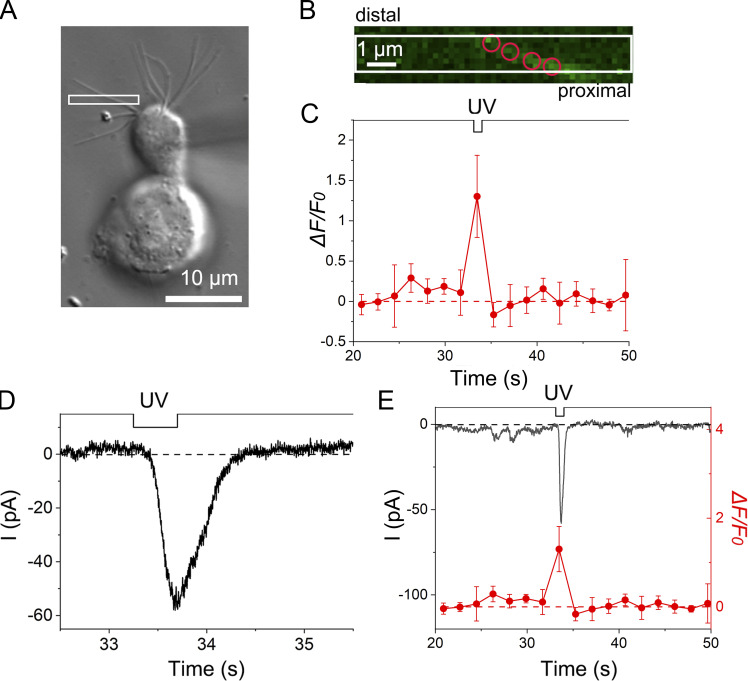
Ca2+ dynamics in the olfactory cilium in the absence of Ca2+ buffer in the recording pipette. (A) Photomicrograph of a single ORC. The white square shows the stimulus ROI. EGTA was not added to the recording pipette. (B) Positions of analysis ROIs (four red circles). Scan mode. Scan speed, 0.45 s/scan. Interval, 1.80 s/scan. Scaling Y, 0.18 µm. Line sum, 4. (C) Fluorescence intensity changes in the cilium. Plots are means of fluorescence intensities that were obtained from four analysis ROIs. Error bars show the SD from those data. (D) The current response to UV irradiation. Stimulus duration, 0.45 s. (E) Superimposition of current response and fluorescence intensity.

