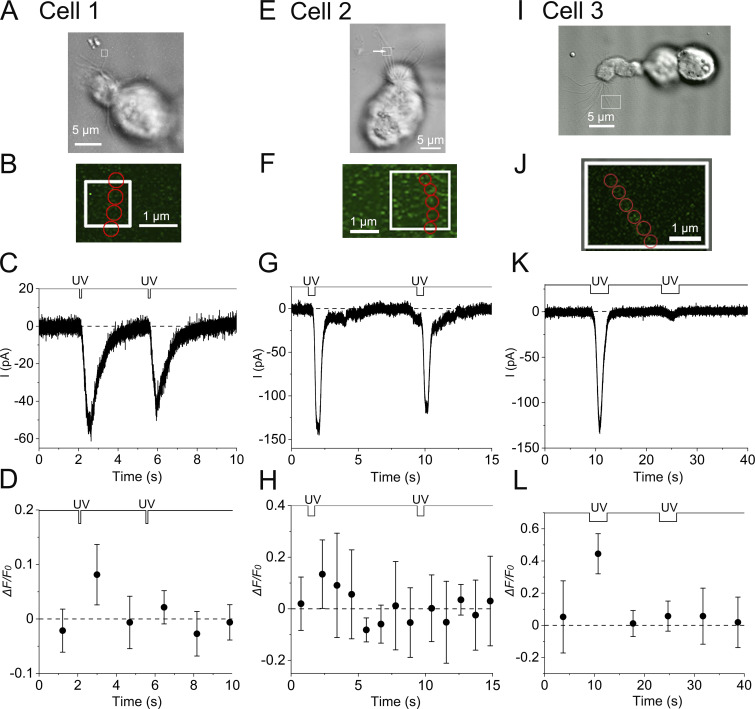
Figure S1.
Time courses of current responses and fluorescence intensities during the adaptation in three cilia from different ORCs. Data presented in A–D are from the same cilium. (A) Photomicrograph of a single ORC (cell 1). The white square shows the stimulus ROI. (B) Positions of analysis ROIs (four red circles, 0.41 µm in diameter). Bleach mode. Scan speed, 0.11 s/scan. Interval, 1.70 s/scan. Scaling Y, 0.045 µm. Line sum, 4. (C) The current response to UV irradiation. Stimulus duration, 0.11 s. (D) Fluorescence intensity changes in the cilium. Plots are means of fluorescence intensities that were obtained from four analysis ROIs. Error bars show the SD from those data. F0 was obtained from data points containing plots outside this time frame (also for H and L). Data in E–H are from the same cilium. (E) Photomicrograph of a single ORC (cell 2). Stimulus ROI was selected as indicated with a white square. The same cell as in Fig. 3 A, but the fluorescence was measured in a different cilium (white arrow). Stimulus ROI may have included multiple cilia and the current response may consist of responses from those cilia. However, our conclusions are not affected by such possibilities. (F) Positions of analysis ROIs (five red circles, 0.41 µm in diameter). Bleach mode. Scan speed, 0.50 s/scan. Interval, 1.09 s/scan. Scaling Y, 0.045 µm. Line sum, 2. (G) The current response to UV irradiation. Stimulus duration, 0.50 s. (H) Fluorescence intensity changes in the cilium. Plots are means of fluorescence intensities that were obtained from five analyses ROIs. Error bars show the SD from those data. Data in I–L are from the same cilium. (I) Photomicrograph of a single ORC (cell 3). Stimulus ROI was selected as indicated with a white square. It may have included two cilia and the current response may consist of responses from those cilia. However, our conclusions are not affected by such possibilities. (J) Positions of analysis ROIs (six red circles, 0.37 µm in diameter). Scan mode. Scan speed, 3.52 s/scan. Interval, 7.00 s/scan. Scaling Y, 0.045 µm. Line sum, 1. (K) The current response to UV irradiation. Stimulus duration, 3.52 s. In the data, the current response to the second stimulus decreased to indicate adaptation, but the rate of decrease is very large. The decrease may have several reasons, including adaptation. (L) Fluorescence intensity changes in the cilium. Plots are means of fluorescence intensities that were obtained from six analyses ROIs. Error bars show the SD from those data.

