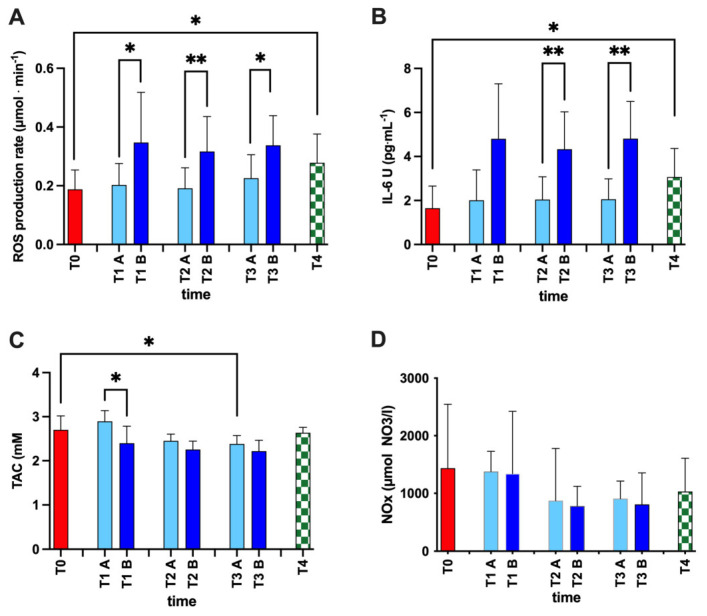
Figure 2.
Histogram panel plots of the oxy-inflammation biomarkers. Time course of (A) reactive oxygen species (ROS), (B) interleukin (IL-6), (C) total antioxidant capacity (TAC), and (D) NO metabolites (NOx) at: T0, basal measure, before the season; T1, at the start of training season; T2, the middle period of the season; T3, the end of the season; and T4, two months after the end of the season. Values recorded from pre- (TA) and post- (TB) training sessions are also reported. Data are expressed as mean ± SD. Statistically significant differences comparison are displayed as: *, p < 0.05; **, p < 0.01.

