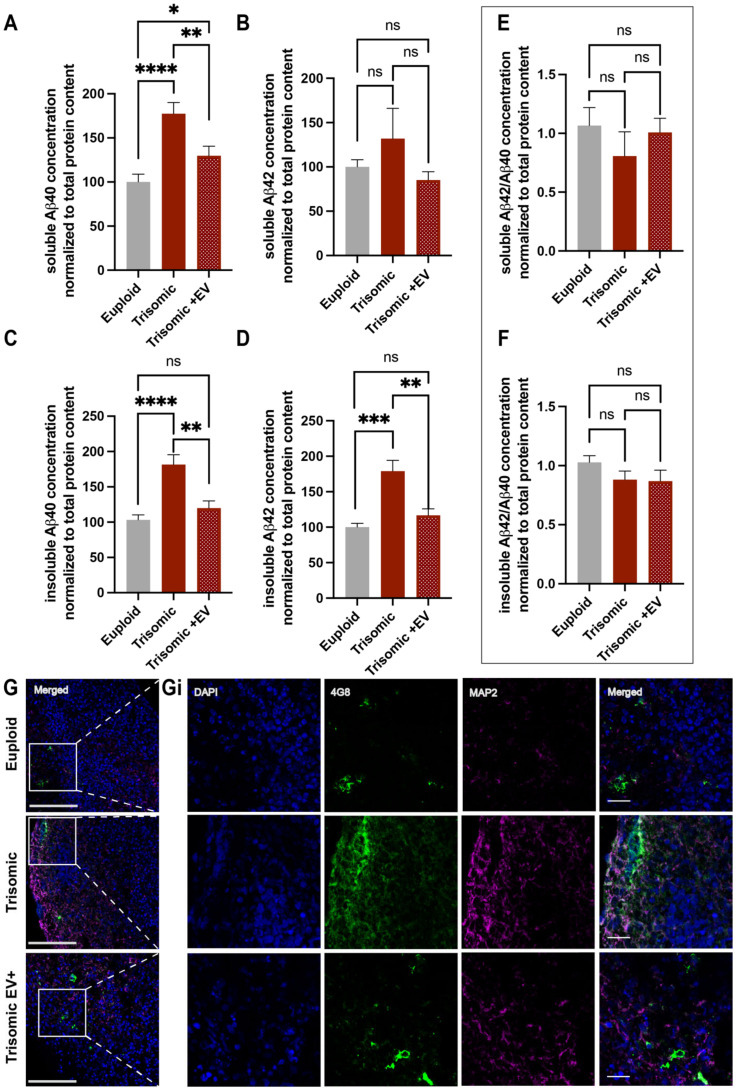
Figure 6.
Measurements of Aβ40 and Aβ42 levels following EV treatment. (A,B) Bar graphs of soluble Aβ40 (A) and Aβ42 (B) concentrations and; (C,D) insoluble Aβ40 (C) and Aβ42 (D) concentrations, calculated as a ratio of Aβ40 and Aβ42 to total protein content assessed via ELISA in euploid and trisomic untreated and EV-treated CS and normalized to the euploid control that was determined as 100% for each independent experiment; (E,F) Bar graph of ratio of soluble (E) and insoluble (F) Aβ42/Aβ40 concentration normalized to total protein content in euploid and trisomic untreated and EV-treated CS, and normalized to the euploid control that was determined as 100% for each independent experiment. For Aβ40, euploid n = 12; trisomic n = 14; trisomic EV+ n = 15 samples per group generated from 4–5 CS combined together per sample. For Aβ42, euploid n = 8; trisomic n = 10; trisomic EV+ n = 11 samples per group generated from 4–5 combined together per sample. These graphs display results from three independent experiments. Statistical analyses were performed via unpaired t-test with Welch’s correction comparing all three groups to each other. Results are shown as mean ± SE. * p < 0.05, ** p < 0.01, *** p < 0.001, **** p < 0.0001, ns = non-significant. (G,Gi) Low magnification merged channel images. White boxes represent insets seen in Gi showing single and merged channels of confocal images of high magnification insets with IHC labeling of 4G8 (green), MAP2 (magenta), and DAPI in euploid and trisomic untreated and EV-treated CS. Low magnification scale bar = 100 µm. High magnification inset scale bar = 20 µm.

