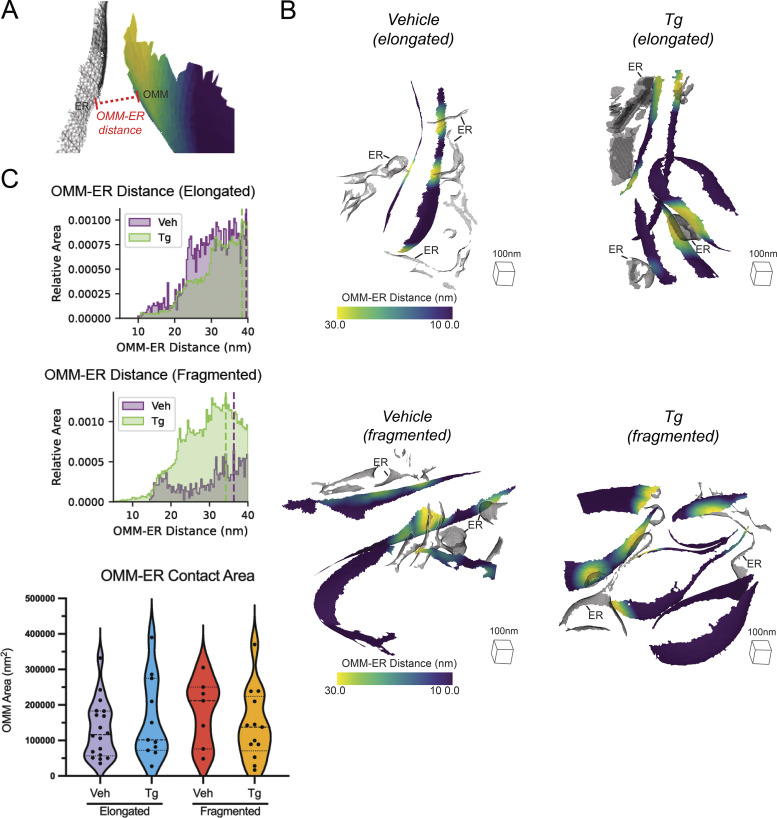
Figure S11.
Surface analysis of mitochondria–ER contact sites. (A) Surface membrane reconstruction defining OMM (blue-yellow gradient) and ER (transparent mesh) distance measurement. (B) Representative membrane surface reconstructions of elongated (top) and fragmented (bottom) mitochondria in MEFmtGFP cells treated with vehicle and Tg (500 nM) colored by OMM to ER (OMM–ER) membrane distance. (C) Combined histogram of OMM–ER distances of elongated (top) and fragmented (bottom) mitochondria in MEFmtGFP cells treated with vehicle and Tg. Dashed vertical lines correspond to peak histogram values of pooled data. (D) Graph showing peak histogram values from each tomogram within each corresponding treatment and mitochondrial morphology class. Quantifications from vehicle elongated n = 18, Tg elongated n = 11, vehicle fragmented n = 7, Tg fragmented n = 13 mitochondria are shown.

