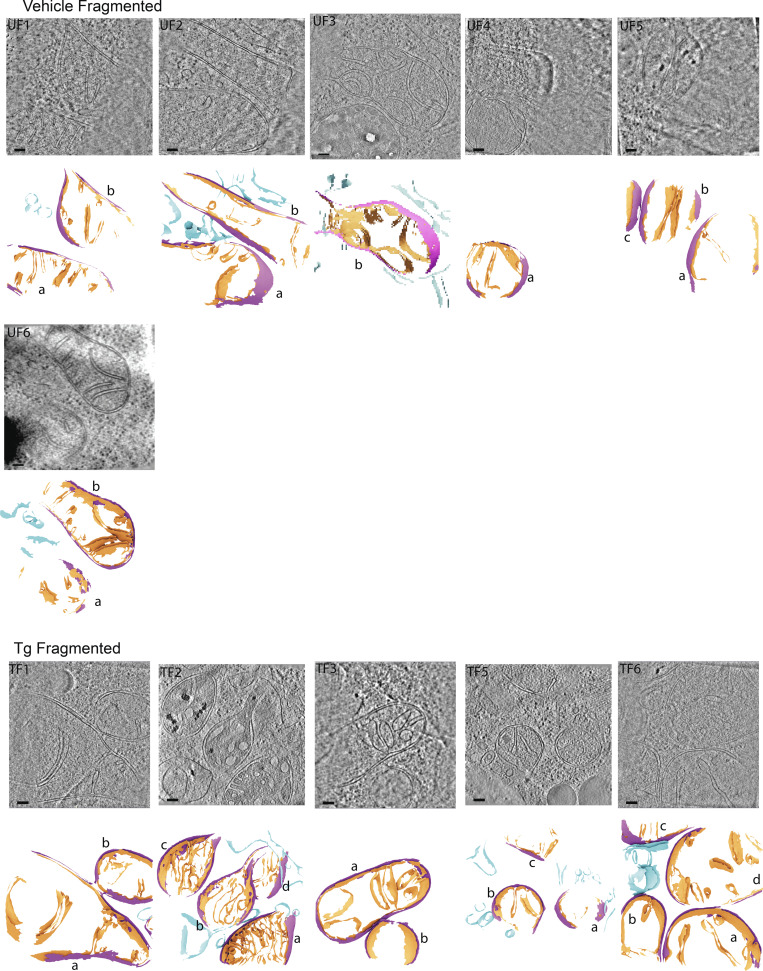
Figure S3.
Gallery of cellular membranes used for downstream quantifications from cells with fragmented mitochondrial networks in the absence and presence of ER stress. Virtual slices of tomograms (upper panels) and corresponding reconstructed surface mesh models (lower panels) of mitochondrial membranes (IMM, orange; OMM, purple) and ER membranes (blue). The surfaces (lower panels) are labeled according to treatment conditions (U, untreated/vehicle-treated), mitochondrial morphology (E, elongated), and tomogram number. For example, “TF1” is Tg-treated, fragmented, tomogram 1. Individual mitochondria in the tomograms are labeled by letters (e.g., a, b, c). These labels correspond to the title labels of the histograms of individual mitochondria shown in Fig. S5. Meshes have been tilted backward by 20° for visualization. Scale bar = 100 nm. Vehicle-treated cells with fragmented mitochondrial networks, n = 6 tomograms; and Tg-treated cells with fragmented mitochondrial networks, n = 5 tomograms.

