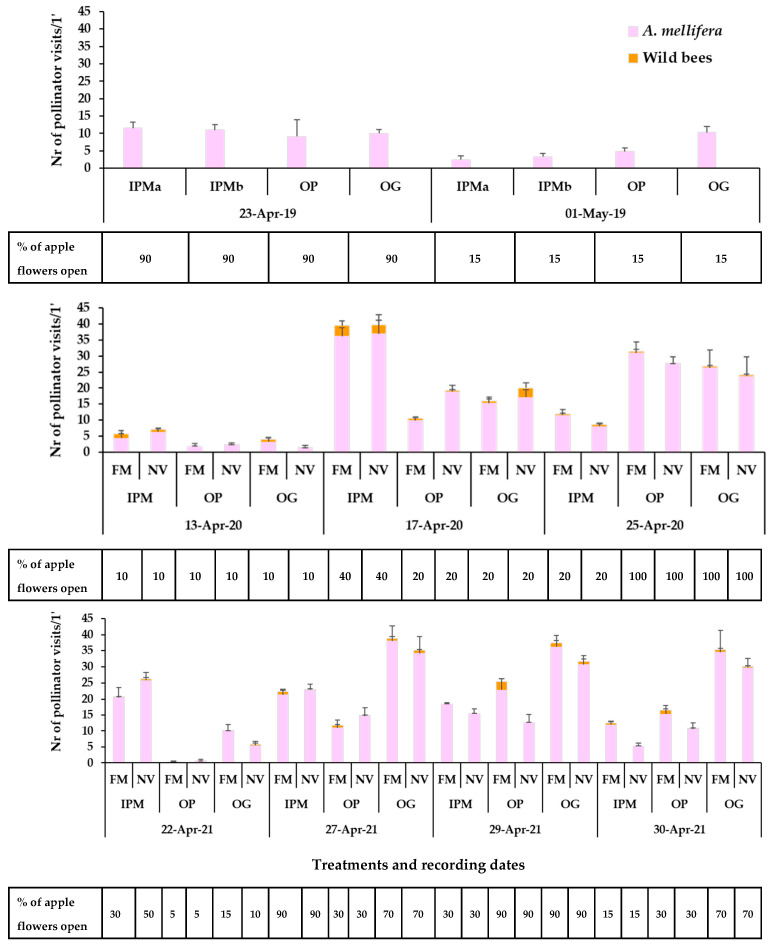
Figure 4.
Mean numbers of Hymenoptera pollinator visits (honey bees, wild bees) on apple flowers recorded for 1 min/6.4 m2 in the baseline year 2019, 2020, 2021. The horizontal bar below each graph represents the percentage of apple flowers open in each plot. IPM: IPM orchard with site (a) and (b) for the baseline year, OP: organic palmette orchard, OG: organic goblet orchard, FM: sown flowering mixture; NV: natural vegetation (wild plants). Vertical bars represent standard error of means.

