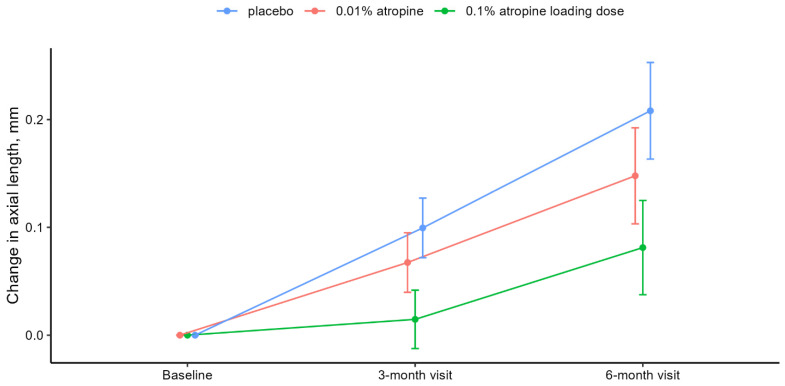
Figure 2.
Change in AL from baseline. Notes: Mean change in axial length from baseline to six-month visit with placebo (blue), 0.01% atropine (red), and 0.1% atropine loading dose (green). Error bars denote the 95% CIs of the mean changes. Means and CIs are derived from the constrained linear mixed model with inherent baseline adjustment. P and adj-P values are presented in Table 2. Abbreviations: adj-P = adjusted P; CI = confidence interval.

