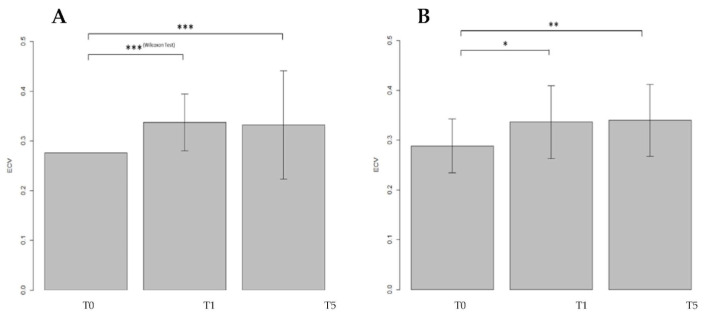
Figure 6.
ECV mean values are presented in bar plots, while SD was expressed with error bars, at different FU times: baseline (T0), first year (T1) and fifth year (T5), both in portal phase (A) and in delayed phase (B) in patients treated with doxorubicin (DOX). Of note, T0 in PP was not normally distributed so SD was not used and the error bar was consequently not reported. A significant increase in mean values was found between T0–T1 and T0–T5. *** p < 0.001; ** p < 0.01; * p < 0.05.

