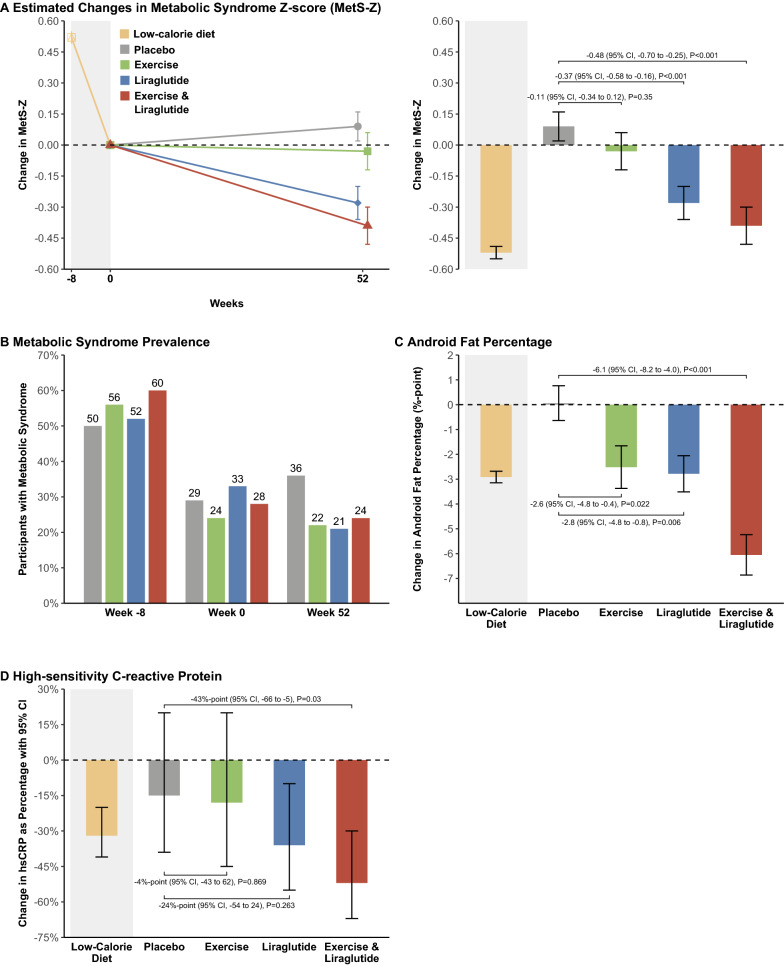
Fig. 2.
Changes During Low-calorie Diet and From Randomization to Week 52. Per-protocol analysis of mixed model estimated changes in metabolic syndrome severity z-score (A), metabolic syndrome prevalence (B), android fat percentage (C), and high-sensitivity C-reactive protein (D) during a low-calorie diet (shaded area; weeks -8 to 0) and treatment (weeks 0 to 52). Changes are estimated mean differences with ± standard error of the mean. Changes in high-sensitivity C-reactive protein are presented as percentages via ratios from back-transformed log-data and shown with 95% confidence intervals. Between-group changes are estimated mean differences with 95% confidence intervals and p-values. Results are adjusted for age group (< / ≥ 40 years) and sex. Dashed line is the baseline for the low-calorie diet and randomized groups (at week 0)

