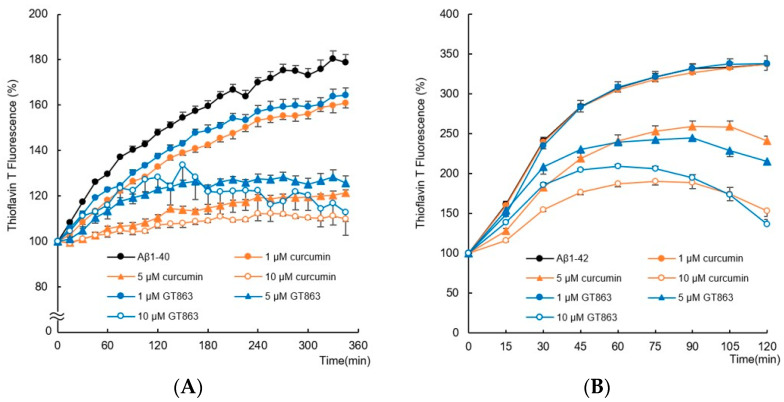
Figure 2.
Inhibitory effect of GT863 and curcumin on Aβ1-40 and Aβ1-42 aggregation kinetics as monitored by the thioflavin-T fluorescence assay. The fluorescence intensity was evaluated with the value immediately before administration as 100%. (A) Aβ1-40 (25 µM) with 0.1% DMSO, curcumin (1, 5, 10 µM), or GT863 (1, 5, 10 µM). (B) Aβ1-42 (25 µM) with 0.1% DMSO, curcumin (1, 5, 10 µM), or GT863 (1, 5, 10 µM). The p-values in ANOVA were < 0.001. Each value expresses the mean ± S.E.M. (n = 6).

