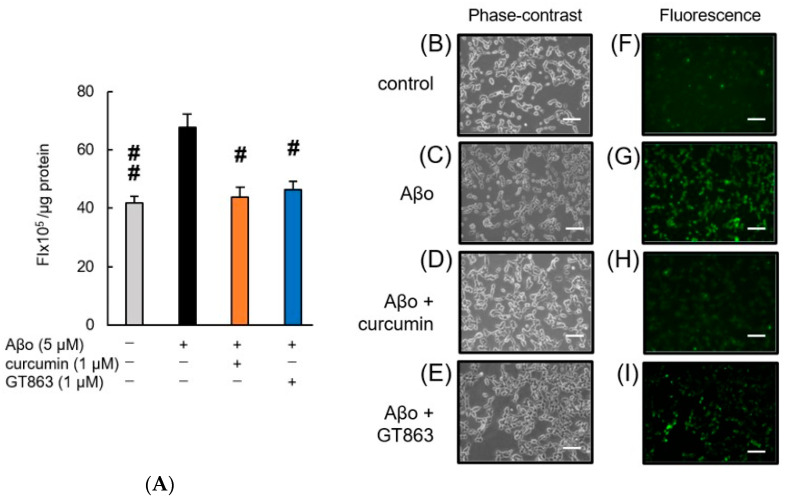
Figure 5.
Effect of curcumin and GT863 on ROS generation in Aβo-stimulated SH-SY5Y cells. (A–I) ROS generation in Aβo-stimulated SH-SY5Y cells was evaluated using CM-H2DCFDA. (A) ROS generation in SH-SY5Y cells exposed to 5 μM Aβo and treated with Aβo + curcumin or Aβo + GT863. The p-values in ANOVA were 0.0002. Each value expresses the mean + S.E.M. of at least 3 independent experiments. In the absence of 5 µM Aβo, ROS levels of 1 µM curcumin-treated and 1 µM GT863-treated cells were 40.63 ± 4.78 and 44.90 ± 4.44 fluorescence intensity × 105/µg protein, respectively (no significant difference, n = 10, Tukey). #, p < 0.05, ##, p < 0.01 for Aβo-exposed cells versus the other treated cells (n = 10, Tukey). (B–E) The SH-SY5Y cells observed using a phase-contrast microscope. (E–H) Fluorescence-microscopic images in SH-SY5Y cells were acquired using an inverted fluorescence microscope. (B,F) Untreated SH-SY5Y cells; (C,G) SH-SY5Y cells exposed to 5 µM Aβo; (D,H) SH-SY5Y cells treated with 5 µM Aβo + 1 µM curcumin; (E,I) SH-SY5Y cells treated with 5 µM Aβo + 1 µM GT863. The scale bars represent 100 μm.

