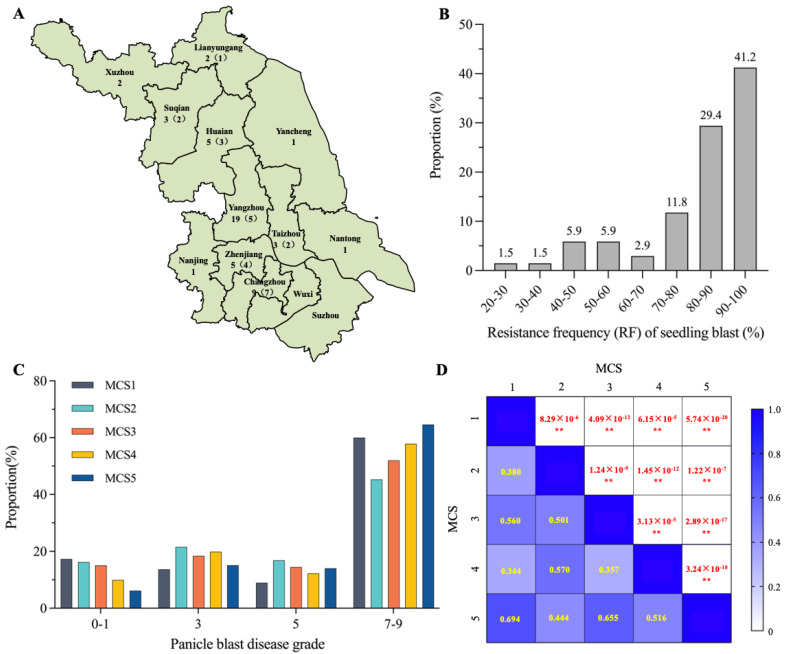
Figure 1.
Evaluation of rice blast resistance of Geng rice varieties in the Jiangsu area. (A) Distribution of 58 M. oryzae isolates used for the artificial inoculation of rice blast in 11 prefectures of Jiangsu province. Numbers on the left denote the number of isolates used for seedling blast inoculation and numbers in parentheses on the right denote the number of isolates used for panicle blast inoculation. (B) Distribution of resistance frequency (RF) of seedling blast. The numbers above the columns denote the proportion of varieties with RF in the corresponding range. (C) Distribution of different panicle blast disease grades after inoculation with 5 groups of mixed conidial suspension (MCS). (D) Correlation of panicle blast disease grades with 5 groups of MCS. Yellow numbers denote the correlation coefficients of the 5 groups, and the red numbers denote the p-values. **: p < 0.01 by Student’s two-sided t-test.

