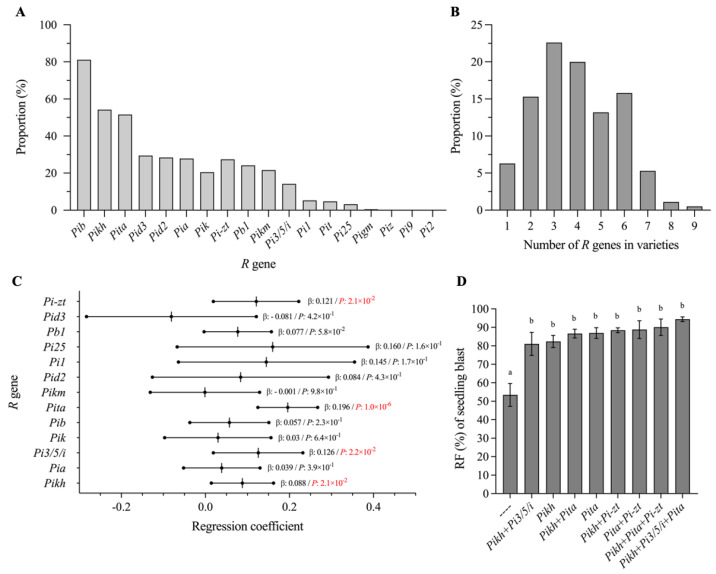
Figure 2.
Distribution of 18 R genes in Jiangsu Geng rice varieties and analysis of elite R genes and R-gene combinations for seedling blast resistance. (A) Distribution frequency of 18 R genes in Jiangsu Geng rice varieties. (B) Distribution frequency of varieties that contain different numbers of R genes. (C) Multiple linear regression analysis of the contribution of each R gene and seedling blast resistance. “β” represents the regression coefficient. Red texts indicate that the contribution of a corresponding R gene to seedling blast resistance has reached a significant level (p < 0.05). (D) Correlation between RF and different elite R genes or R-gene combinations in seedling blast resistance. Different lowercase letters indicate significant differences according to Duncan’s multiple range tests (p < 0.05).

