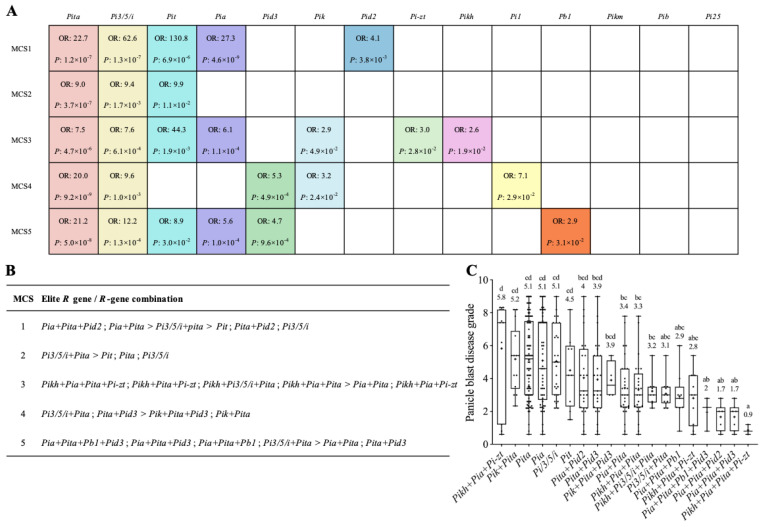
Figure 3.
Analysis of elite R genes and R-gene combinations for panicle blast resistance. (A) Summary of the R genes that have significant contributions to panicle blast resistance in 5 MCS groups. OR represents the odds ratio. p-value compares varieties with and without the test R gene according to Duncan’s multiple range tests. (B) Summary of the elite R genes/R-gene combinations that have significant contributions to panicle blast resistance in each MCS inoculation. The panicle blast disease grades of those elite R genes/R-gene combinations were significantly lower than their corresponding control in respective MCS; their disease grades are in ascending order from left to right. “>” indicates significant differences according to Duncan’s multiple range tests. (C) Comparison of the panicle blast disease grades of different elite R-gene combinations. The numbers indicate the average disease grades. Different lowercase letters denote significant differences according to Duncan’s multiple range tests (p < 0.05).

