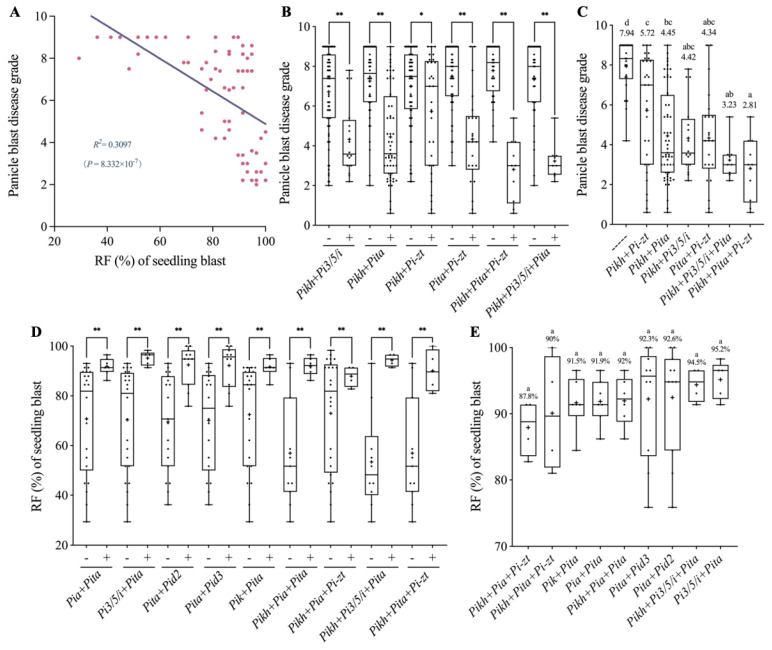
Figure 4.
Correlation analysis between seedling blast resistance and panicle blast resistance. (A) Regression analysis of seedling blast RF and panicle blast disease grade. (B) Comparison of the panicle blast disease grades in 5 MCSs between elite R-gene combinations and corresponding controls from seedling blast resistance tests. “−” and “+” denote the varieties with or without corresponding gene combinations. **: p < 0.01 and *: p < 0.05 by Student’s two-sided t-test. (C) Comparison of panicle blast disease grades between different elite R-gene combinations from (B). The numbers indicate average disease grades. Different lowercase letters indicate significant differences according to Duncan’s multiple range tests (p < 0.05). (D) Comparison of the seedling blast RFs between elite R-gene combinations and corresponding controls from panicle blast resistance tests. “−” and “+” denote the varieties with or without corresponding gene combinations. **: p < 0.01 by Student’s two-sided t-test. (E) Comparison of the seedling blast RFs between different elite gene combinations from (D). The numbers indicate average RFs.

