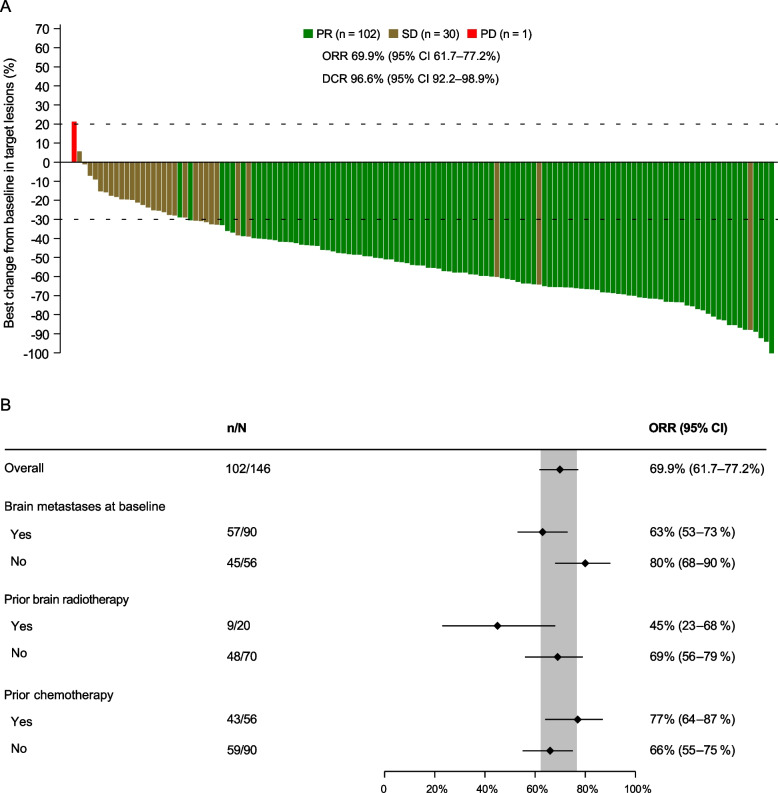
Fig. 2.
Waterfall plot of systemic BOR (A) and forest plot of systemic objective response in subgroups (B). Response was assessed by IRC in the FAS (the same as the PPS). The dashed lines at 20% and -30% indicate the thresholds for PD and PR, respectively. There were nine and four patients with IRC-assessed BOR of non-CR/non-PD and NE, respectively. BOR, best objective response; CR, complete response; PR, partial response. SD, stable disease. PD, progressive disease. ORR, objective response rate. DCR, disease control rate. IRC, independent review committee. NE, not evaluable. FAS, full analysis set. PPS, per-protocol set

