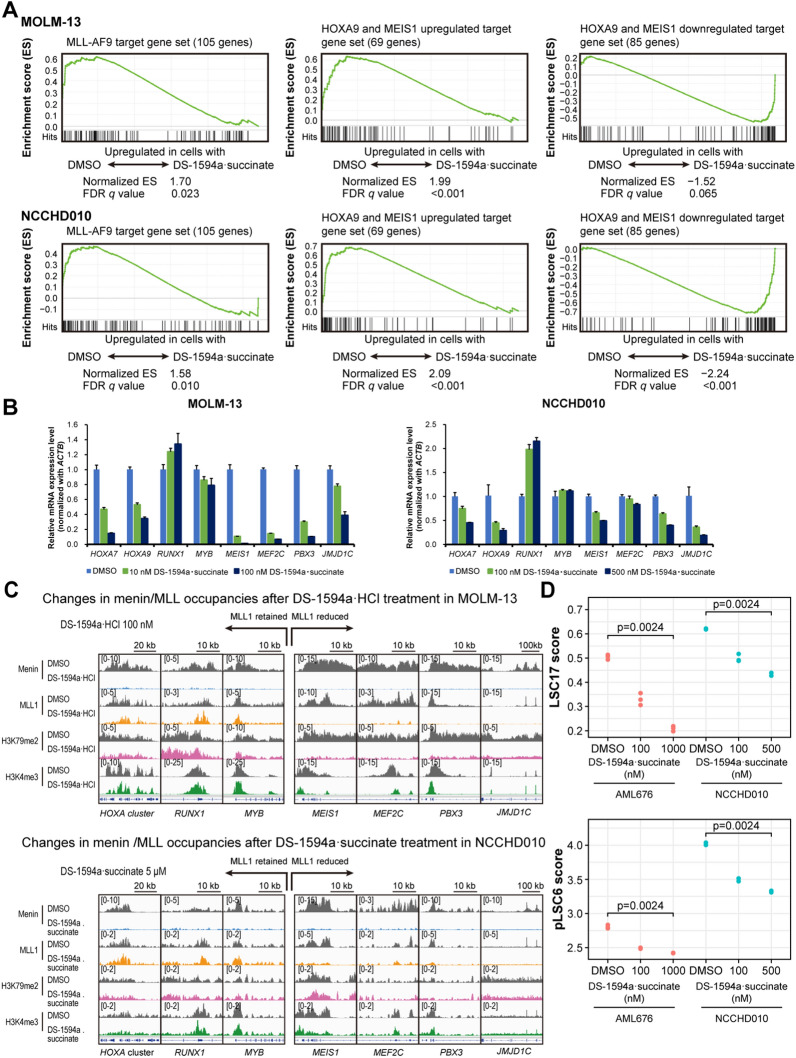
Fig. 4.
The Menin-MLL1 inhibitor induced gene expression changes through Menin-MLL1 chromatin-associated complexes. A RNA-seq was performed in MOLM-13 and NCCHD010 cells treated with DS-1594a·succinate for 3 and 7 days, respectively. GSEA of MOLM-13 cells treated with 100 nM DS-1594a·succinate for 3 days and NCCHD010 cells treated with 500 nM DS-1594a·succinate for 7 days. B RT‒qPCR was performed in MOLM-13 and NCCHD010 cells treated with DS-1594a·succinate for 3 and 7 days, respectively, at the indicated concentrations. The graphs represent the expression levels of the indicated genes compared to those in the DMSO-treated control (mean ± SD, n = 3). C Changes in Menin/MLL1 occupancies in MOLM-13 and NCCHD010 cells treated with 100 nM or 5 μM DS-1594a·HCl or DS-1594a·succinate, respectively, for 3 days. Normalized coverage tracks of Menin, MLL1, H3K79me2, and H3K4me3 ChIP-seq signals (reads per million) at selected target genes in MOLM-13 or NCCHD010 cells are shown. The peaks around the TSS are shown. D Analysis of the leukemic stem cell score. LSC17 scores and pLSC6 scores in AML676 and NCCHD010 cells were calculated for each sample treated with DMSO or DS-1594a·succinate at the indicated concentrations (n = 3). The numbers on the plots are P values of the Jonckheere-Terpstra trend test with Bonferroni correction. For the GSEA, the t test results were used as the metrics for scoring and ranking genes. The FDR q value for each gene set was calculated with the permutation of the gene sets. LSC17, 17-gene adult LSC; pLSC6, 6-gene pediatric LSC; TSS, transcription start site

