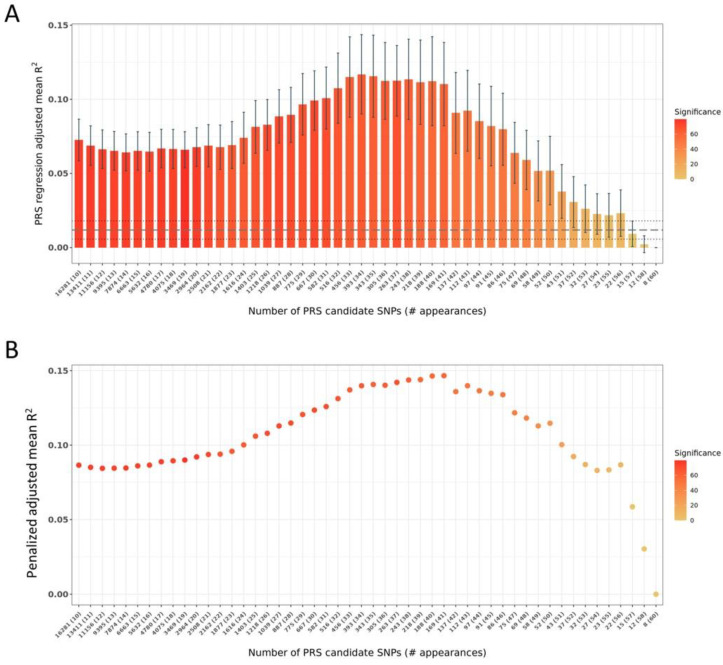
Figure 1.
Mean PRS and penalized PRS R2 for the assembled PRS candidates based on their frequency of appearance over 10 iterations as described in Materials and Methods. (A). Mean PRS R2 +/− standard deviation for PRS candidates assembled from SNPs at different frequencies of appearance in the PRS candidates across 100 PRS extraction iterations. The vertical axis depicts the mean adjusted PRS R2, while the horizontal axis depicts the number of SNPs in each PRS candidate. The number inside the parentheses next to the number of SNPs in the horizontal axis depicts the SNP frequency of appearance in the PRS. For example, 393 (34) means that the PRS at that particular R2 consists of 393 SNPs that appear at least 34 times over 100 iterations. The color scale denotes the statistical significance (Student’s t-test p-value in −log10 scale) of the adjusted R2 distribution over 100 de novo PRS extraction iterations (baseline R2) as compared to the adjusted R2 distribution of each assembled PRS candidate in the horizontal axis. The mean baseline (derived directly from PRSice2 outcomes for each iteration) R2 is depicted with the dashed grey horizontal line, and the dotted grey horizontal lines depict the standard deviation of the former. (B). Mean penalized according to the number of SNPs PRS R2.

