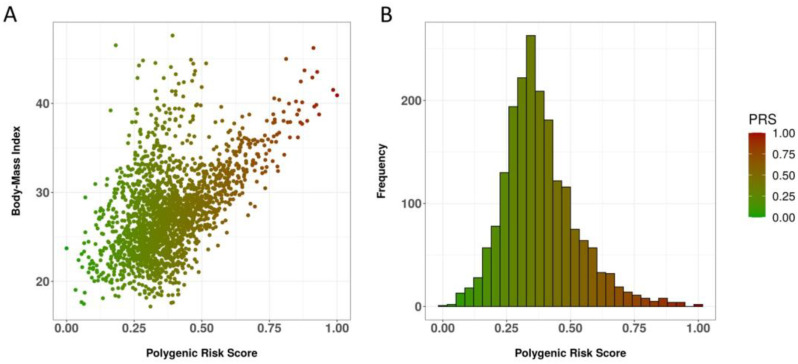
Figure 2.
Correlation of the 343-SNP PRS for BMI with the phenotype and PRS distribution. (A). The BMI phenotype across the merged dataset is plotted against the min–max-normalized PRS value for each individual. (B). Histogram depicting the min–max-normalized PRS distribution for all individuals in the merged dataset.

