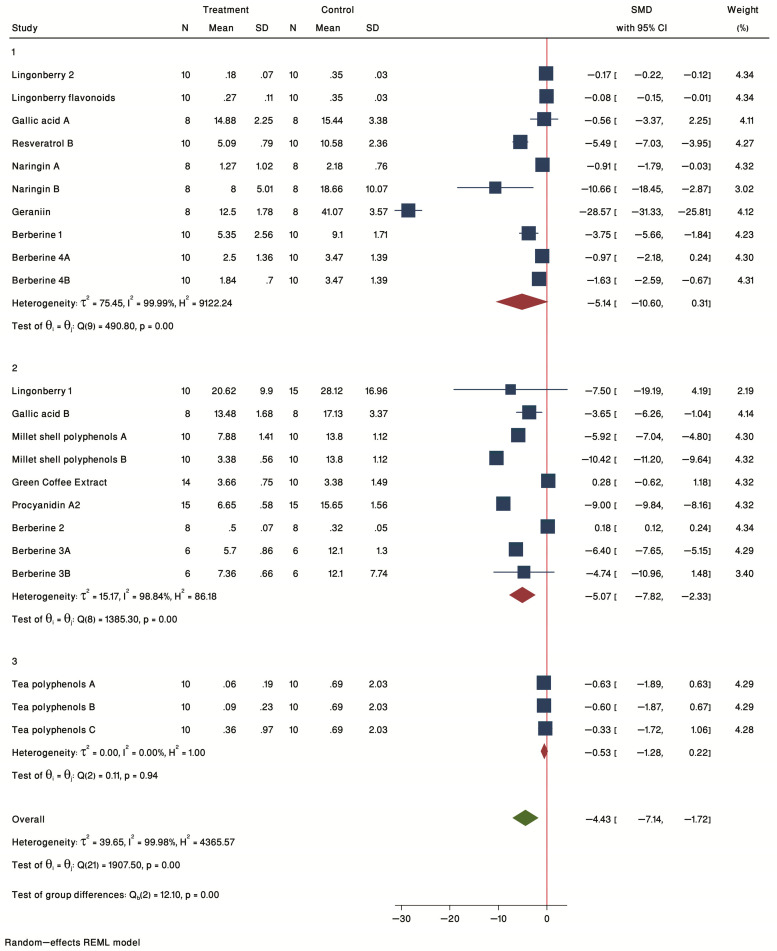
Figure 4.
Forest plot of individual SMD of plaque size grouped by sex. The analysis included six studies conducted in female mice, six studies conducted in male mice, and two studies conducted in both sexes. The common effect size was calculated as SMD and 95% CI for each study outcome. Squares represent findings for individual studies; red diamonds represent the overall result for each sub-group analysis and the green diamond the overall effect of the meta-analysis for all the studies.

