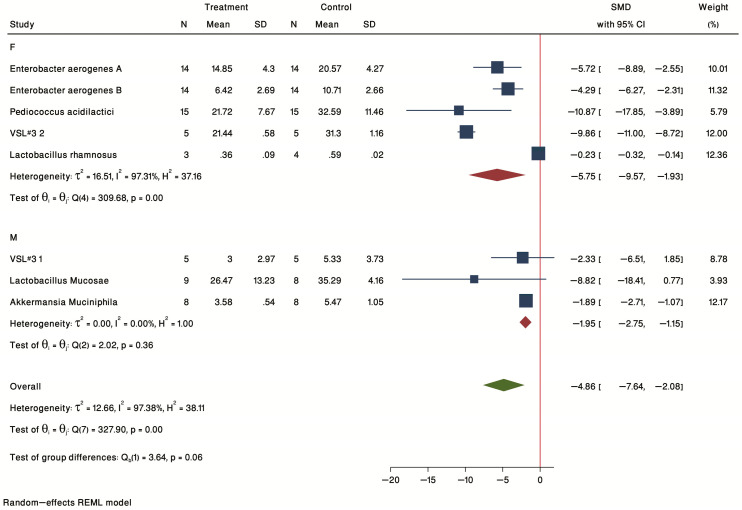
Figure 8.
Forest plot of individual SMD of plaque size sub-grouped by sex. Four studies were conducted on females, and three studies were conducted on males. The common effect size was calculated as SMD and 95% CI for each study outcome. Squares represent findings for individual studies; red diamonds represent the overall result for each sub-group analysis and the green diamond the overall effect of the meta-analysis for all the studies.

